
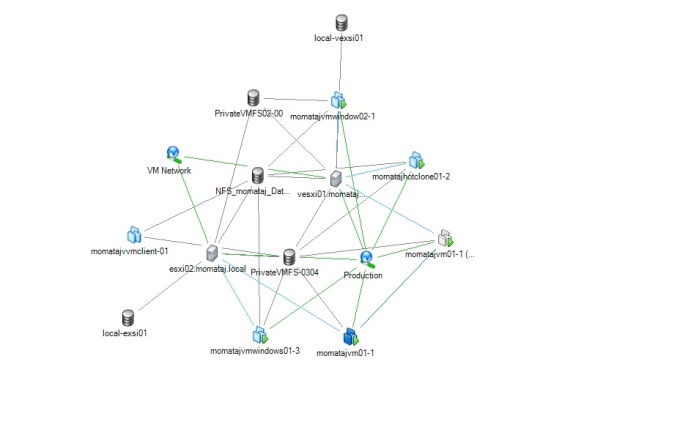
Reference Project Architecture: 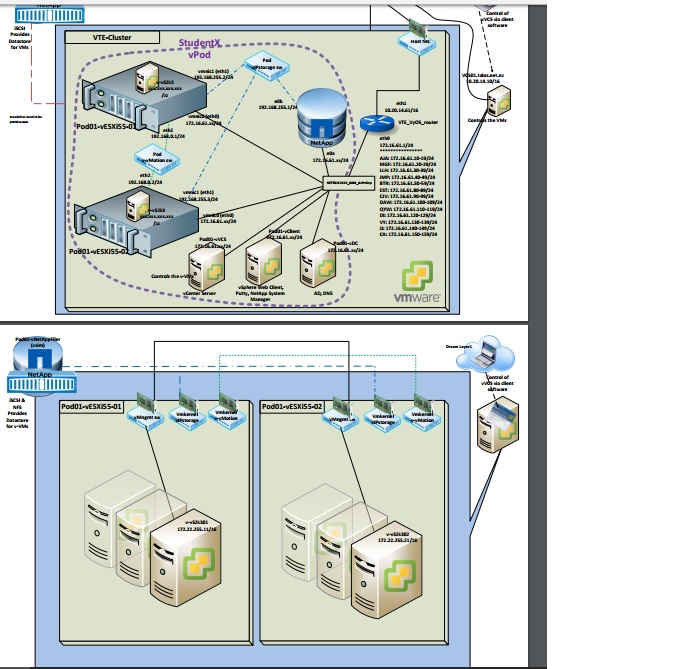
In this lab, I am going to install![]() , configure, and use VMware vSphere Update Manager.
, configure, and use VMware vSphere Update Manager.
Update Manager facilitates centralised, automated patch and version management for VMware vSphere and offers support for VMware ESX/ESXi hosts, virtual machines, and virtual appliances.
You can perform the following activity with the Update Manager:
- Upgrade and patch ESX/ESXi hosts
- IInstall and update third-party software on hosts
- Upgrade virtual machine hardware, VMware Tools, and virtual appliances
The tasks list for lab 25:
- Install vSphere Update Manager
- Install the Update Manager Client Plug-In
- Modify Cluster Settings
- Configure vSphere Update Manager
- Create a Patch Baseline
- Attach a Baseline and Scan for Update
- Stage the Patches onto the ESXi Hosts
- Remediate the ESXi hosts
Prerequisites:
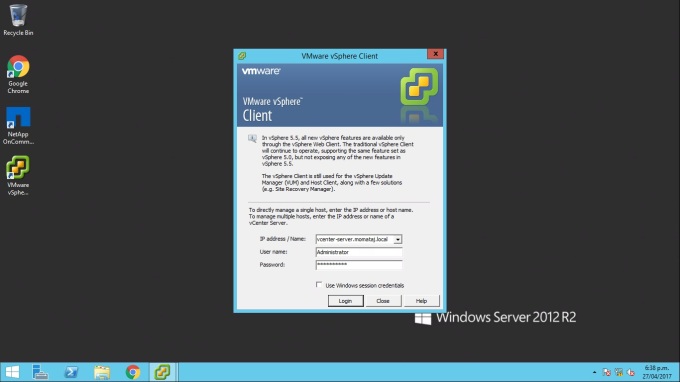
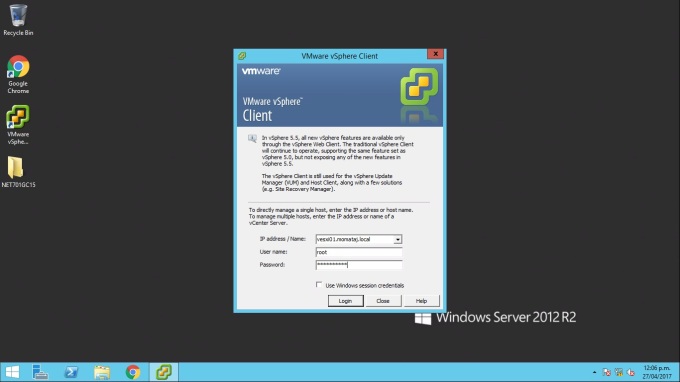
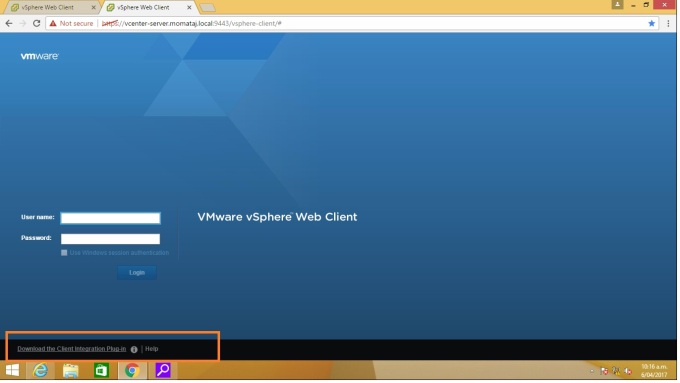
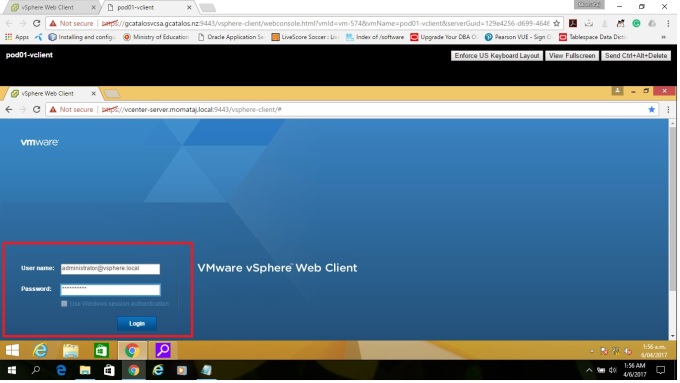
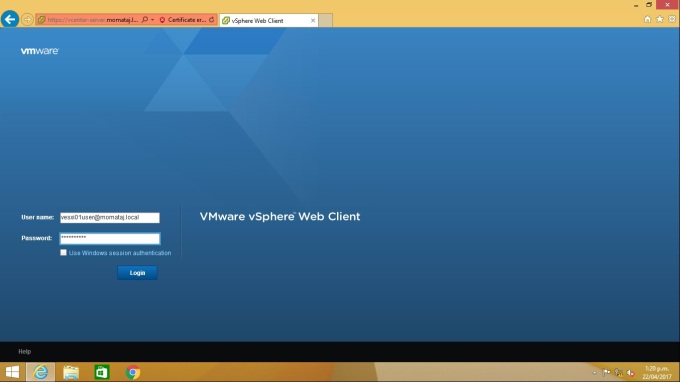
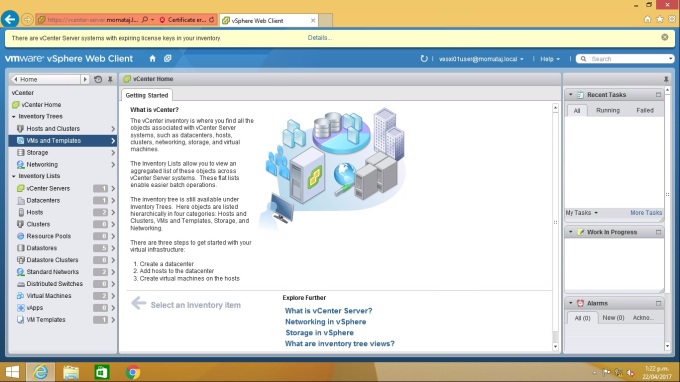
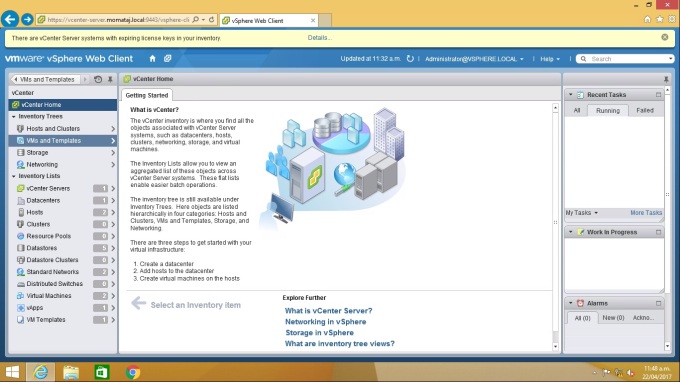
- Log in the VMware vSphere web client portal: https://vCenter Server Appliance Name.domainname:9443/vshpere-client/# or VMware vSphere Client via root user and password.
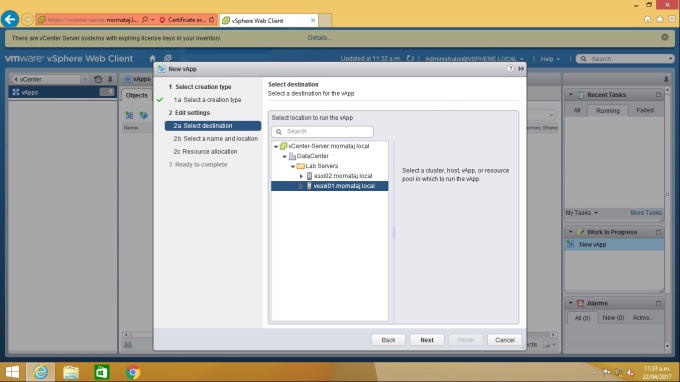
Steps for the task: Install![]() vSphere Update Manager
vSphere Update Manager
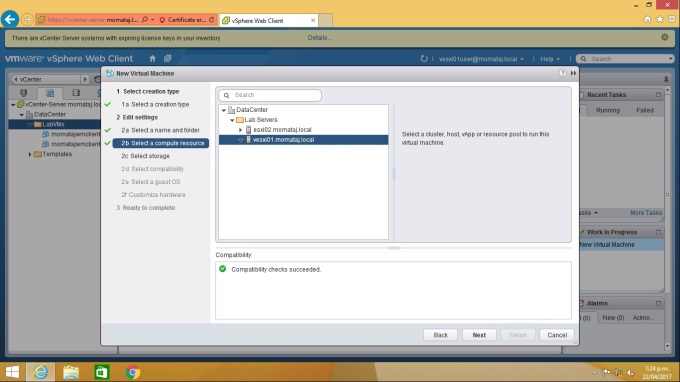
I am going to show how to install![]() vSphere Update Manager in my System.
vSphere Update Manager in my System.
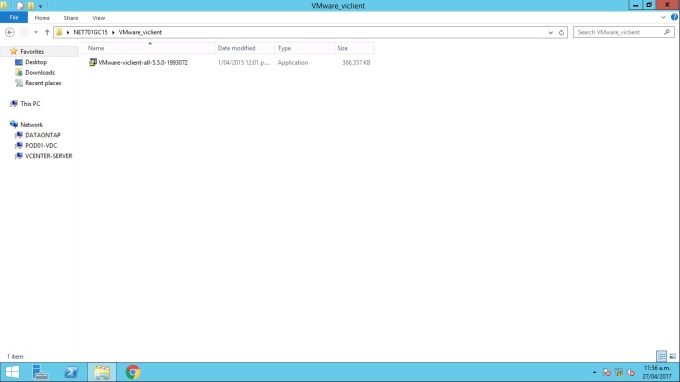
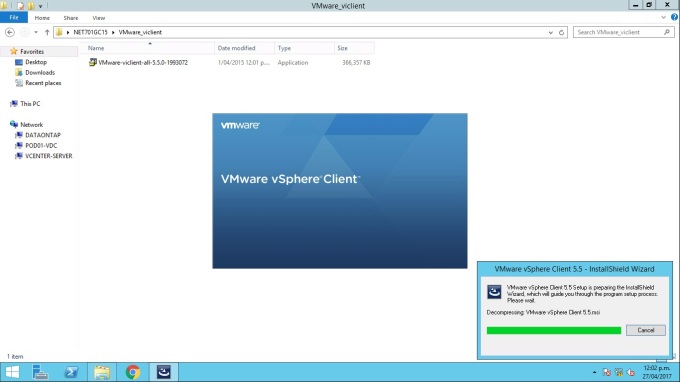
Step 1: Double click on the autorun.exe file and Run.
The VMware vSphere 5.5 vCenter Installer is displayed.
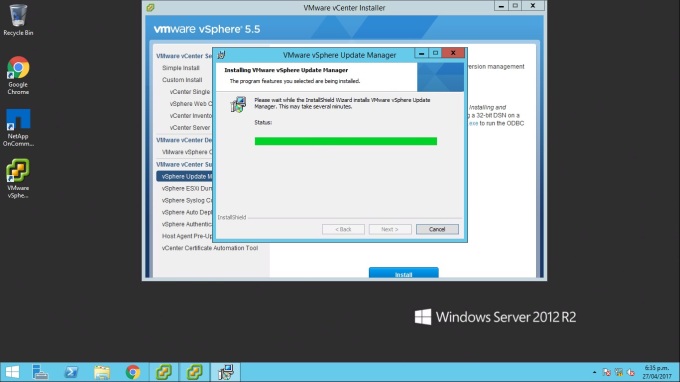
Click the vSphere Update Manager Link. Then Click “Install” to start the installation![]() Wizard
Wizard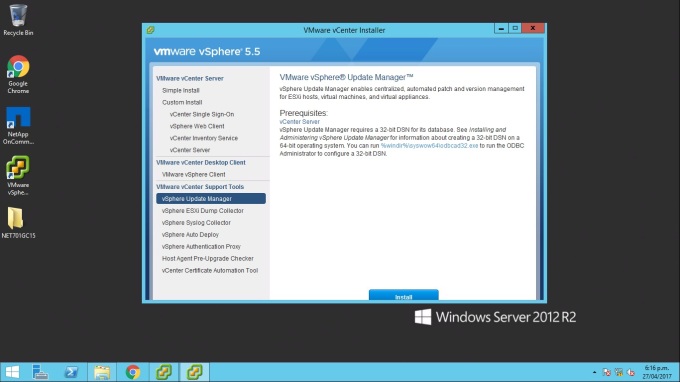
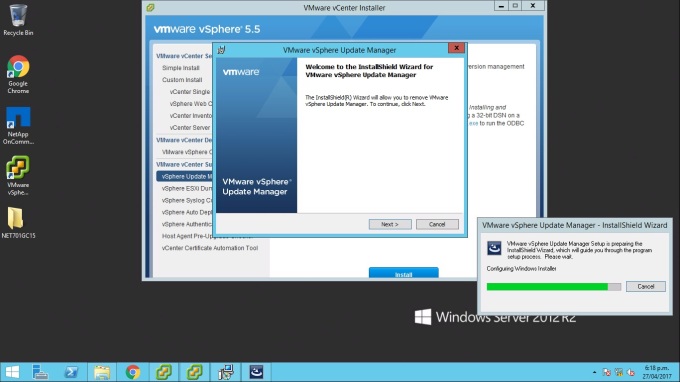
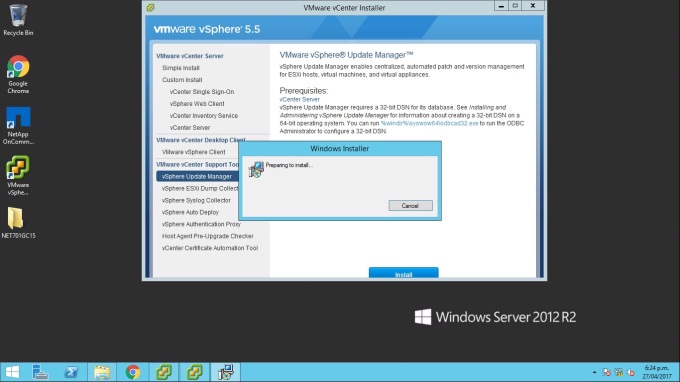
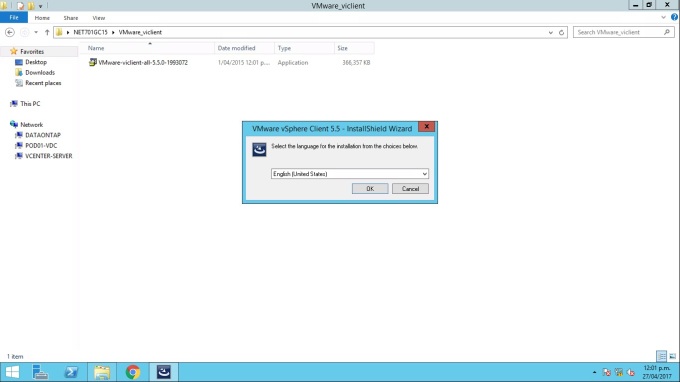
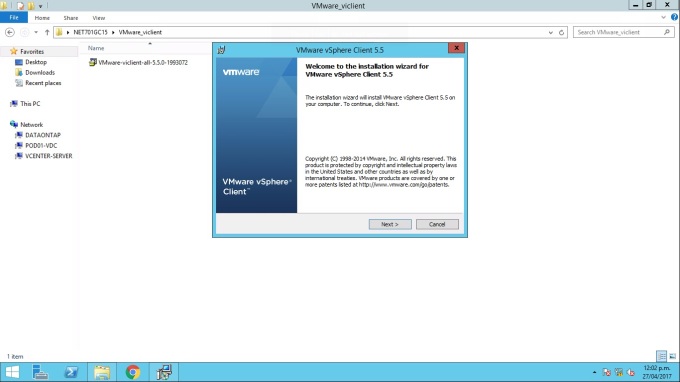
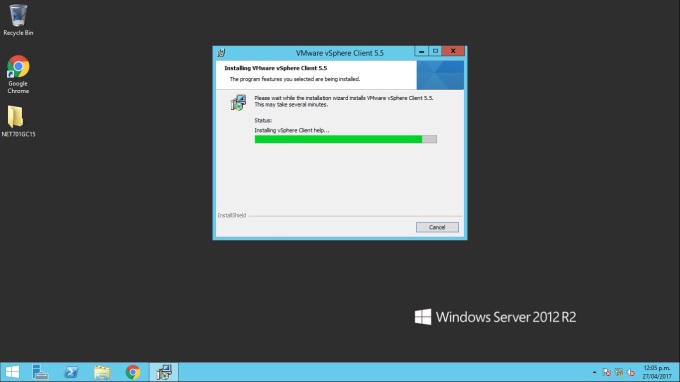
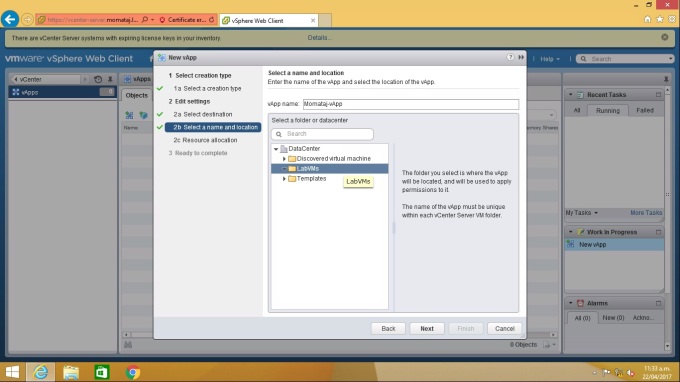
Step 2: Now you need to perform the following installation![]() action that I showed the following screenshot. I already did it. You just need to follow and provide the necessary information
action that I showed the following screenshot. I already did it. You just need to follow and provide the necessary information

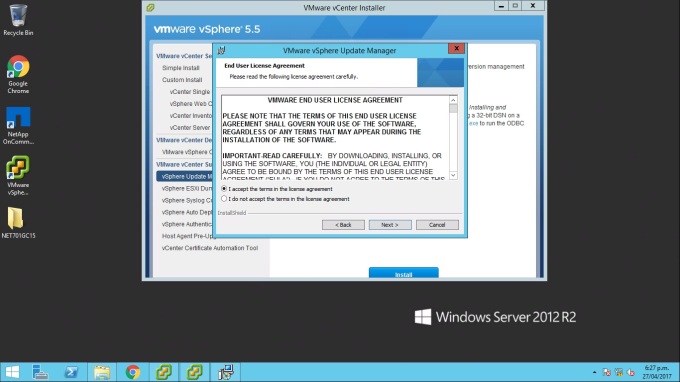

Provide your root username and Password

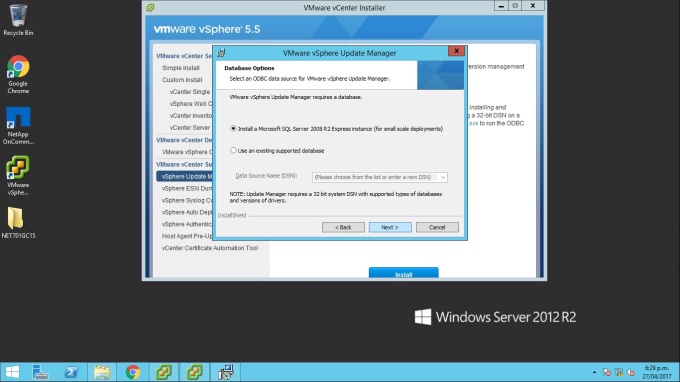
Accept the default database option and click Next
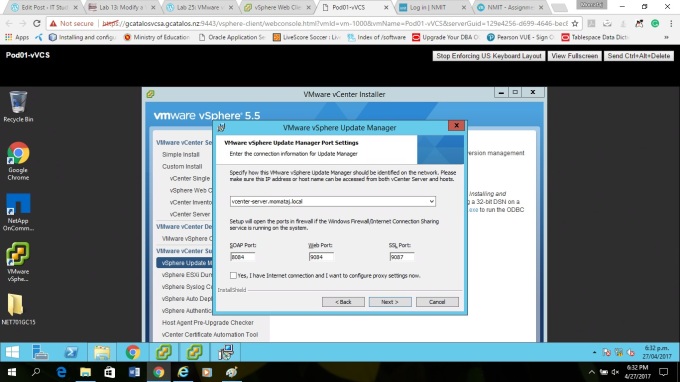
If your name resolution is working, select the hostname; otherwise, continue with the host IP address.
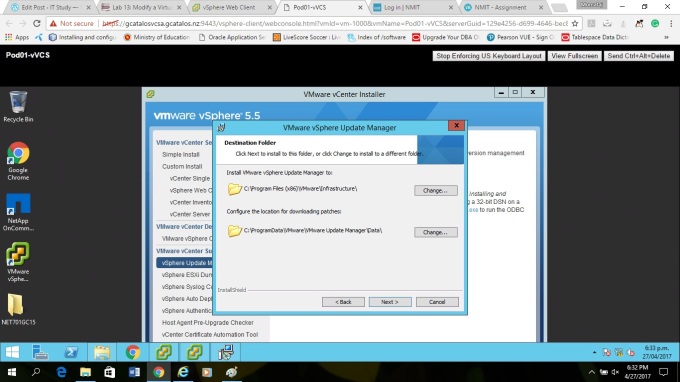
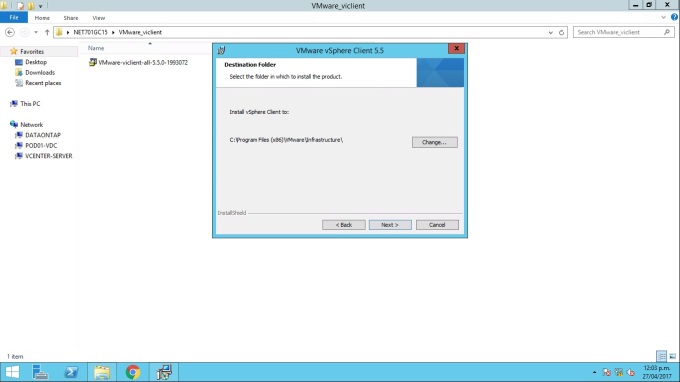
Accept the default setting but If you want, you can change the destination address.
Steps for the task: Install![]() the Update Manager Client Plug -In
the Update Manager Client Plug -In
You can install the Update Manager client plug-in to use vSphere Update Manager that is provided as a plug-In for the VMware vSphere Client.
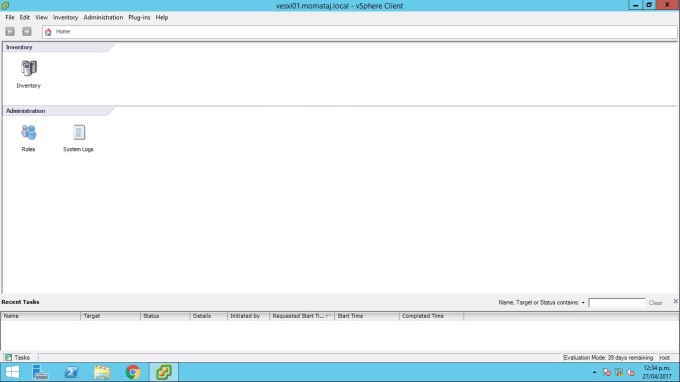
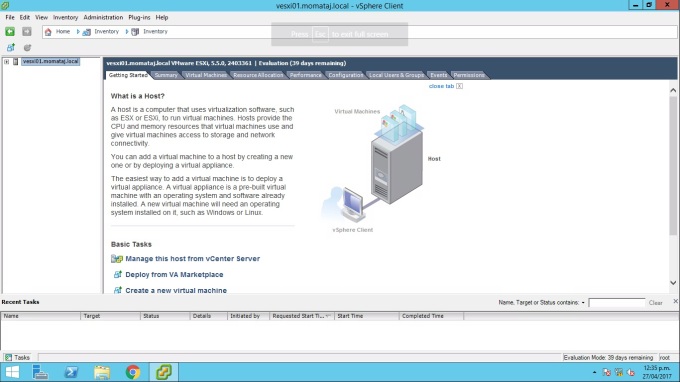
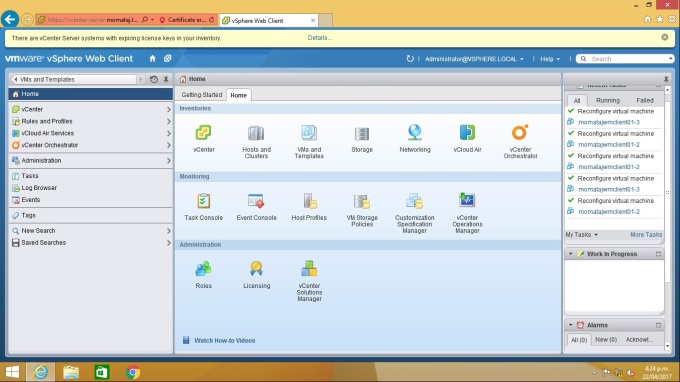
Step 1: Log in vCenter Server through vSphere Client using your administrator user and Password
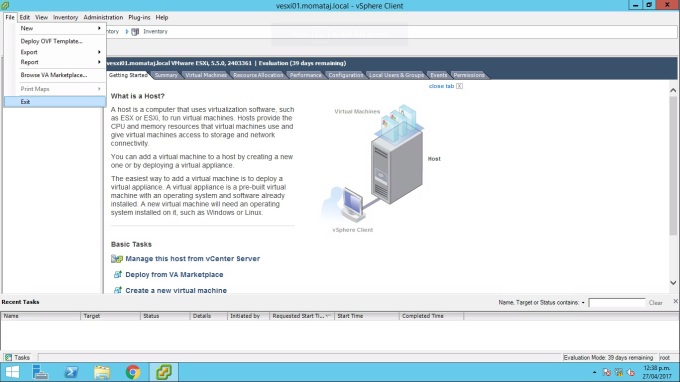
Step 2: Installation![]() Process: Go to the Plug-In menu bar ->Manager Plug-In
Process: Go to the Plug-In menu bar ->Manager Plug-In
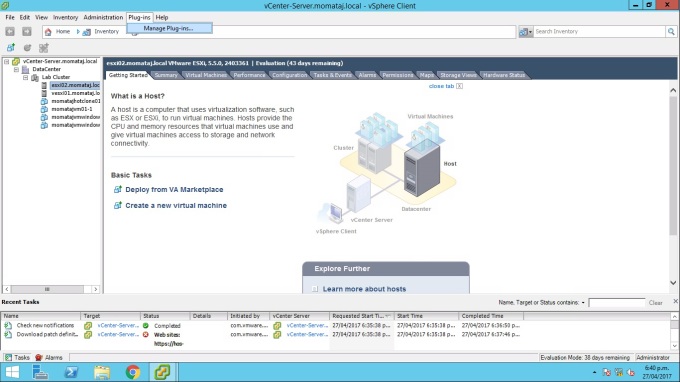
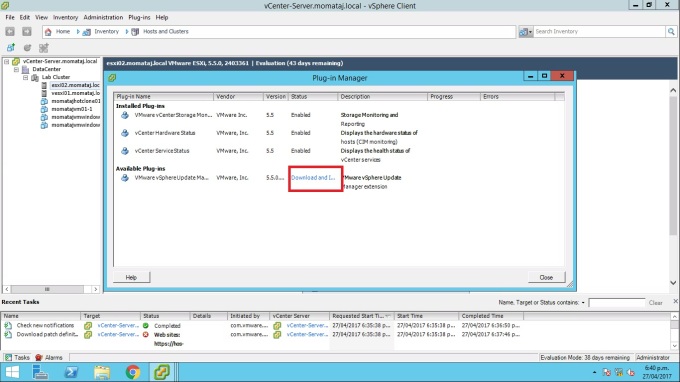
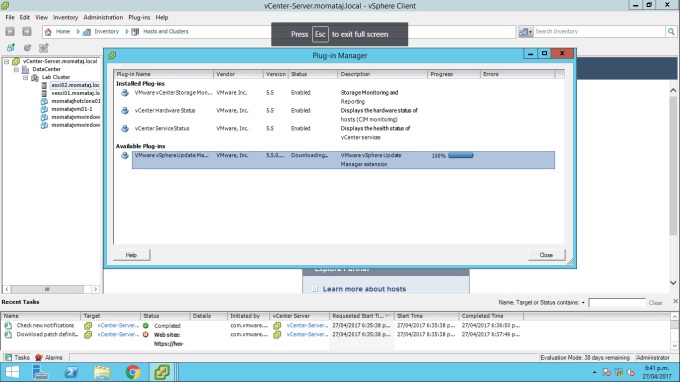
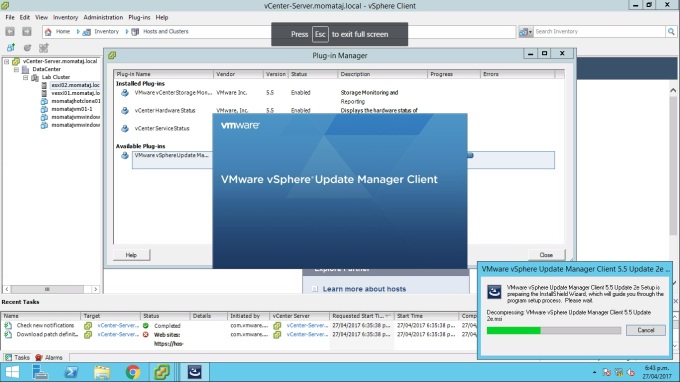
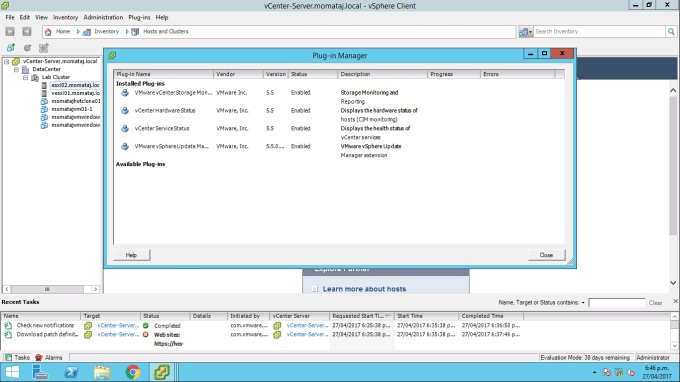
Step 3: Now continue the installation![]() process, you have to perform the following actions that I showed in the Screenshot.
process, you have to perform the following actions that I showed in the Screenshot.
Under the available Plug-ins in the Plug-in-Manager window, click the “Download and Install” link.
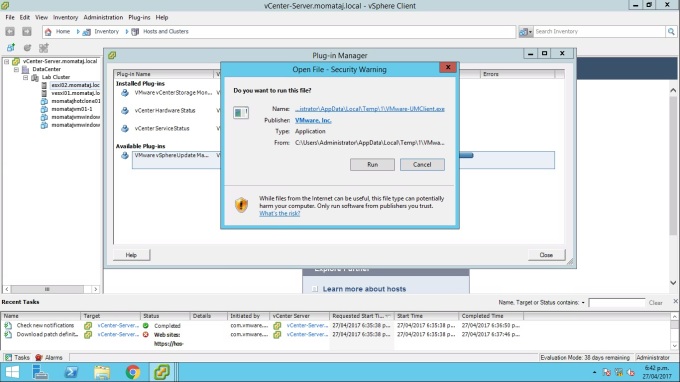
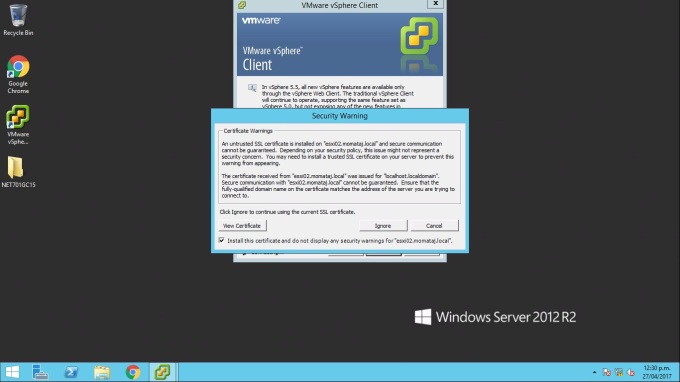
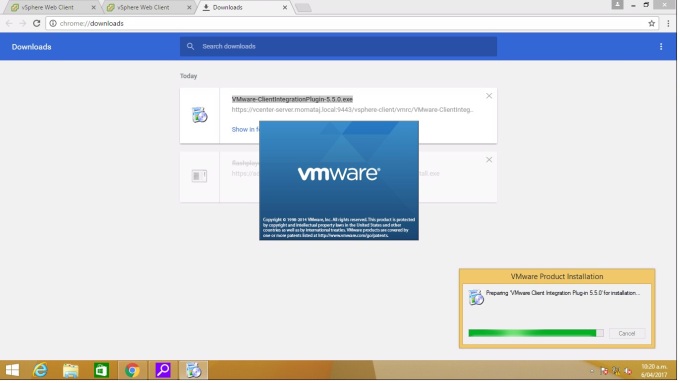
In this step, you will get a Security warning dialogue box, click “Run”
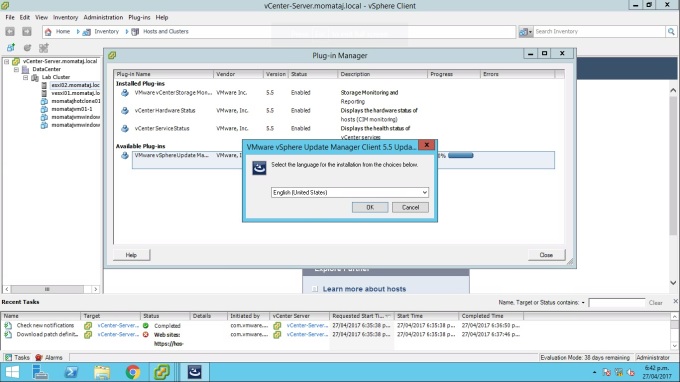
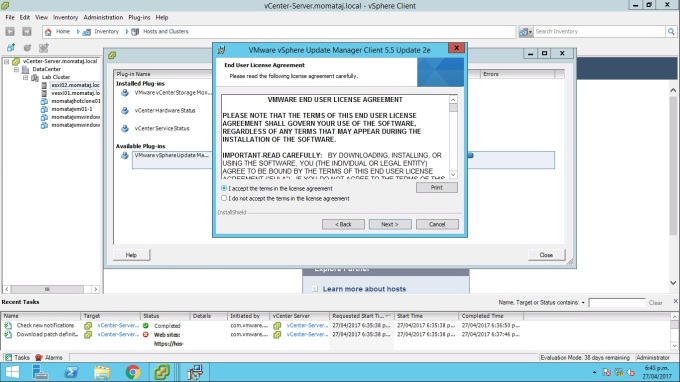
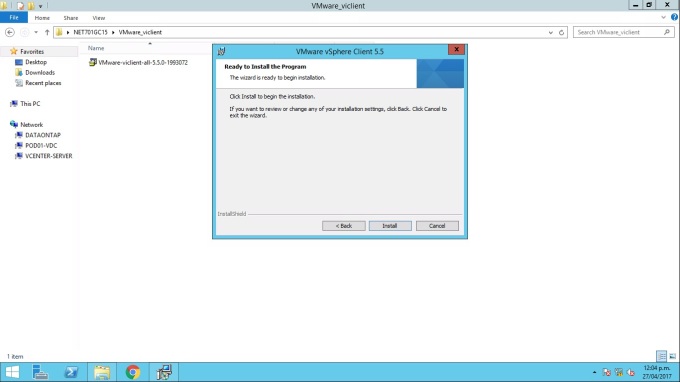
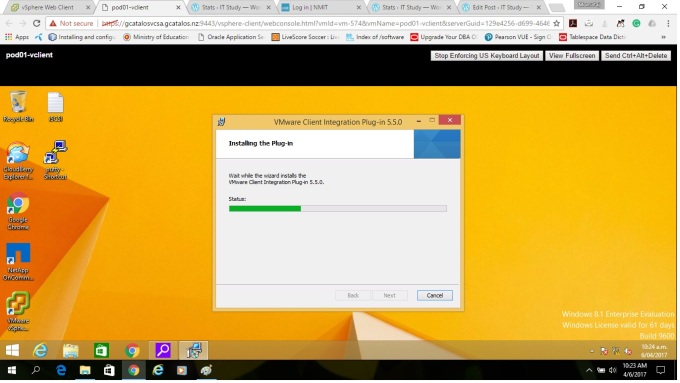
Click Install![]() ” button to progress the installation.
” button to progress the installation.
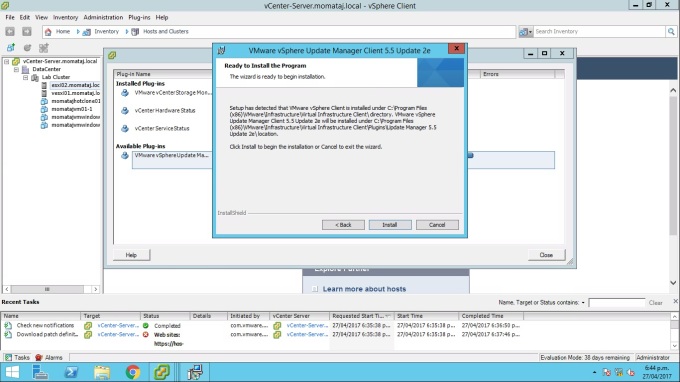
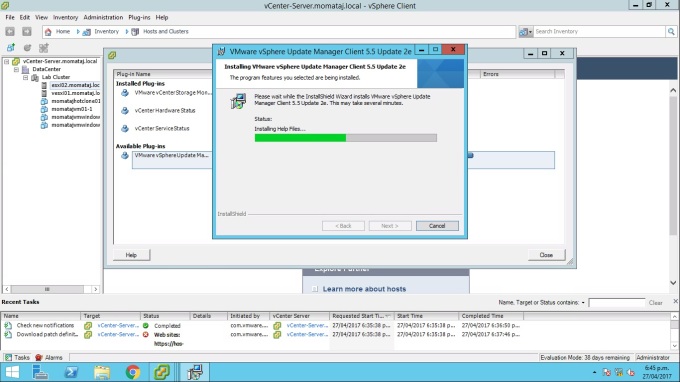
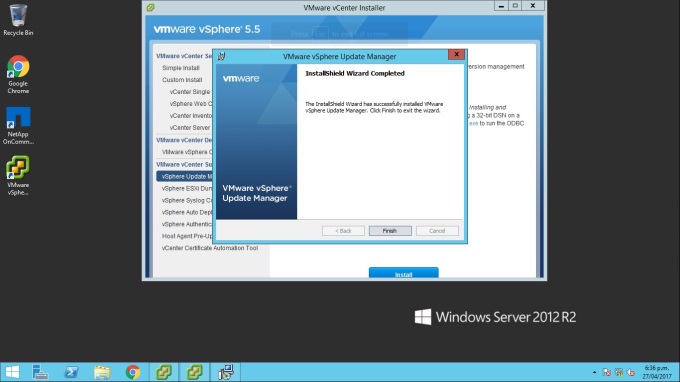
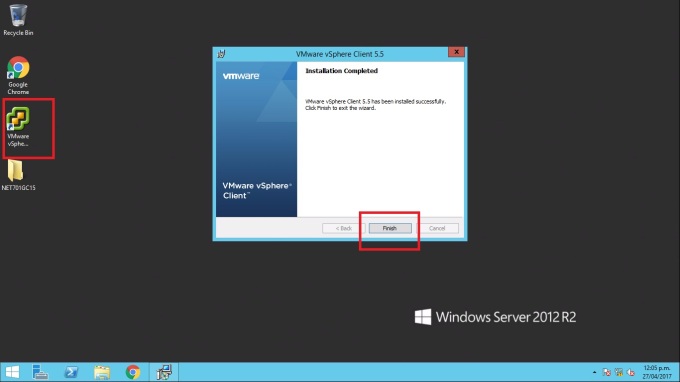
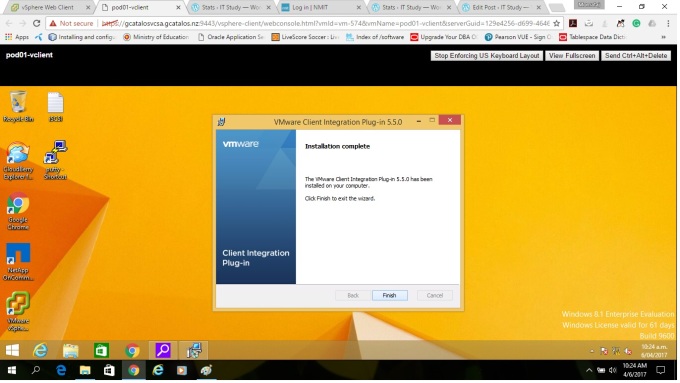
Click “Finish” to complete the Installation.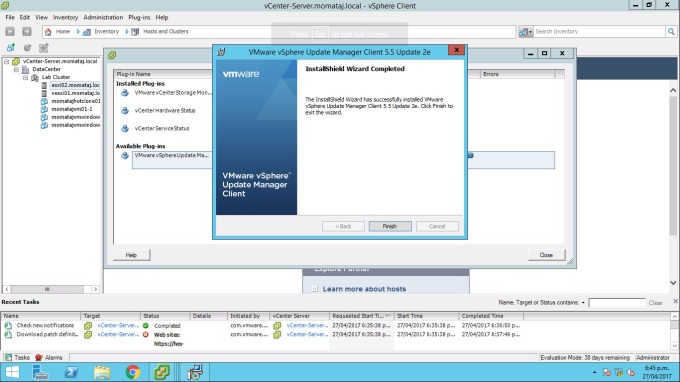
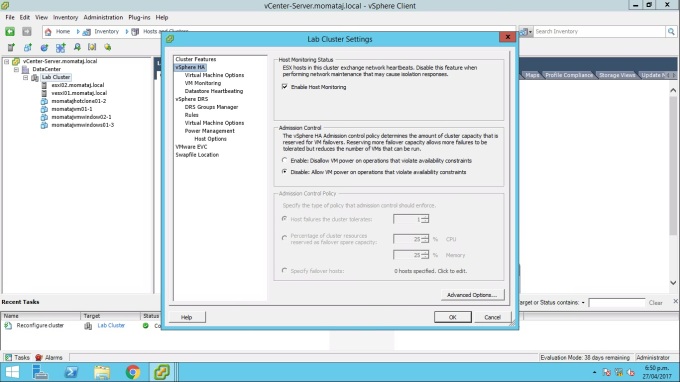
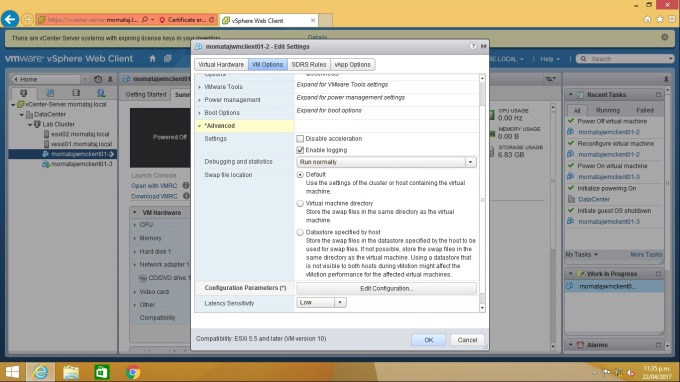
Steps for the task: Modify Cluster Settings
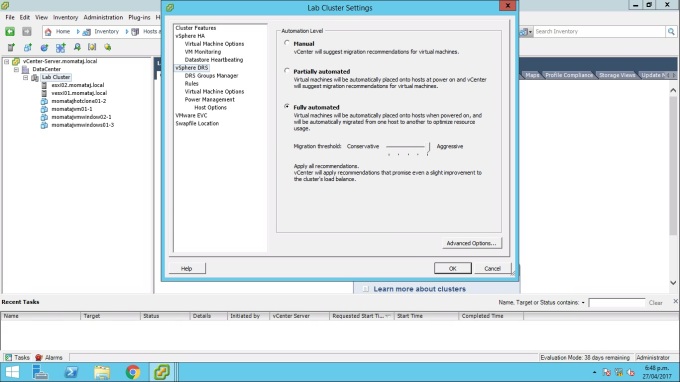
In this section, I will enable VMware vSphere Distributed Resource Scheduler (DRS). For this task, I chose a fully automated mode and disable VMware HA admission control.
The Configuration Procedure:
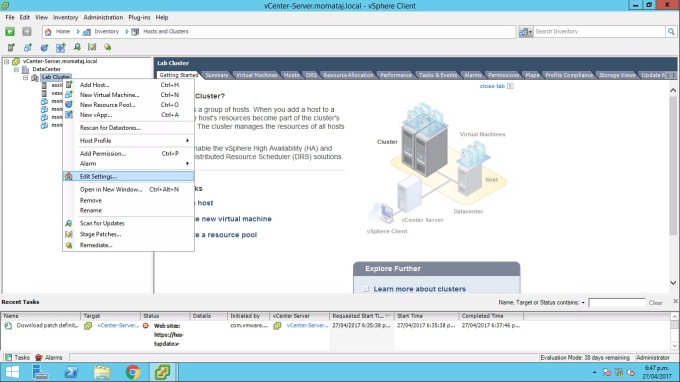
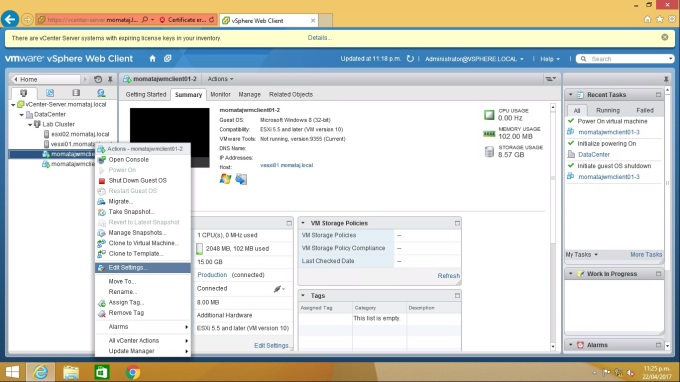
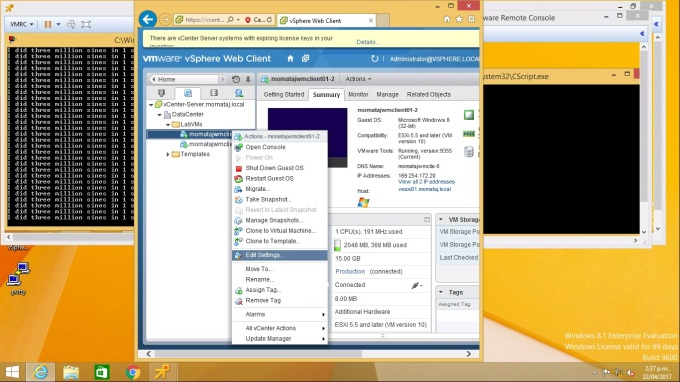
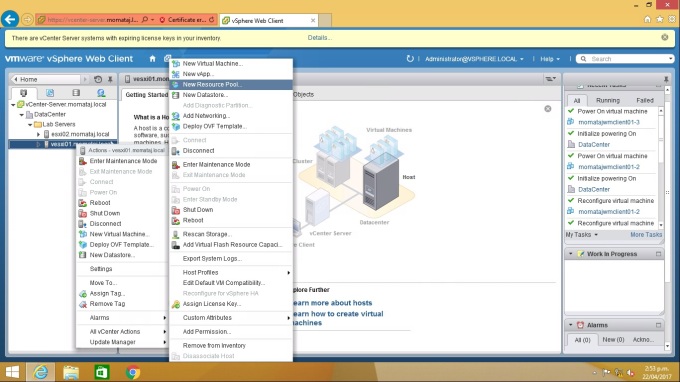
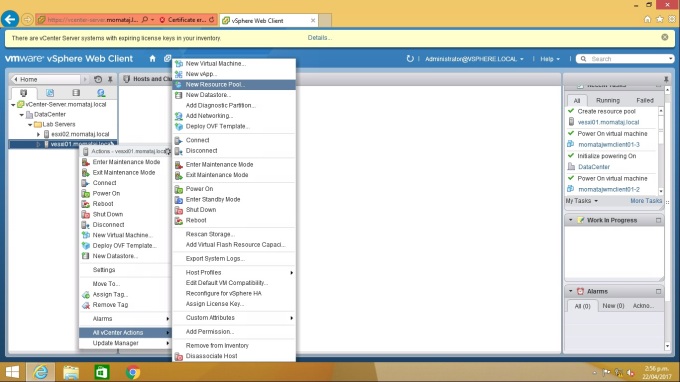
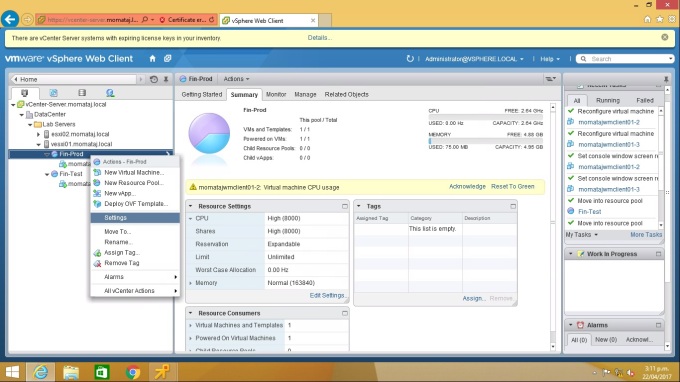
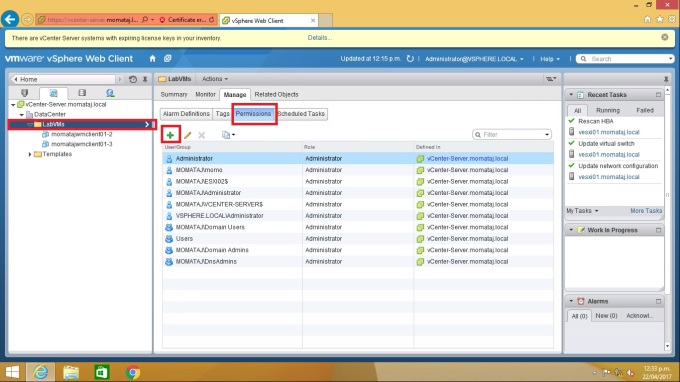
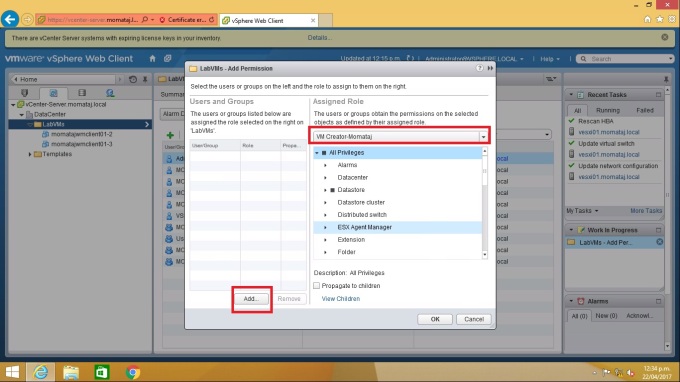
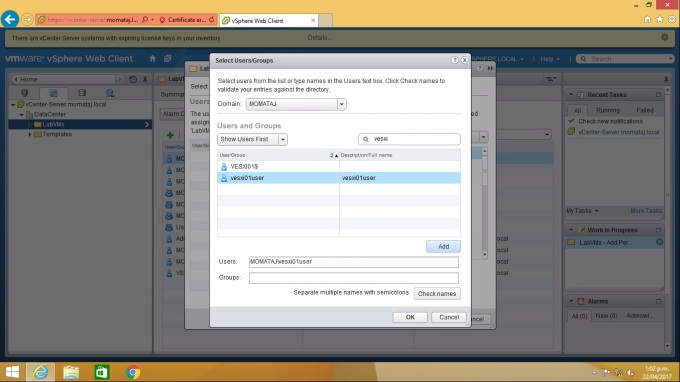
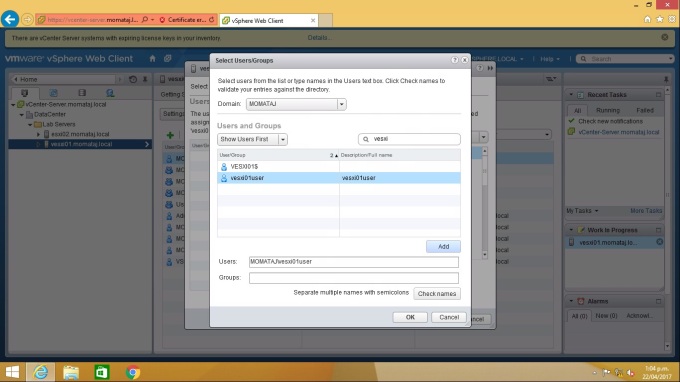
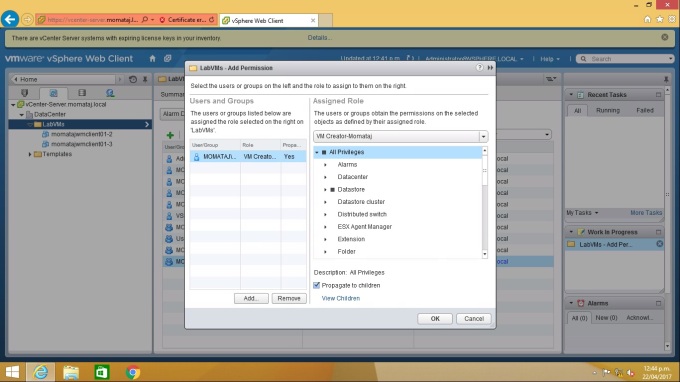
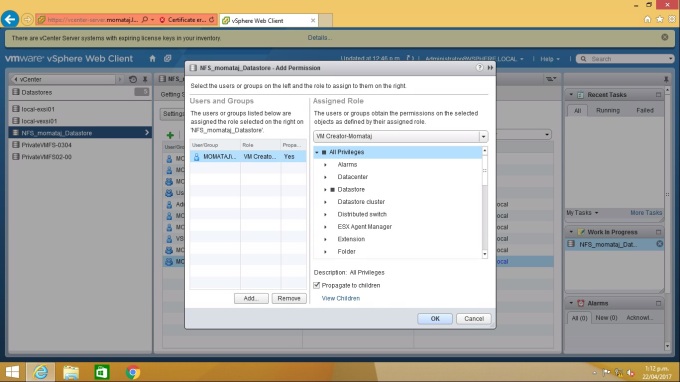
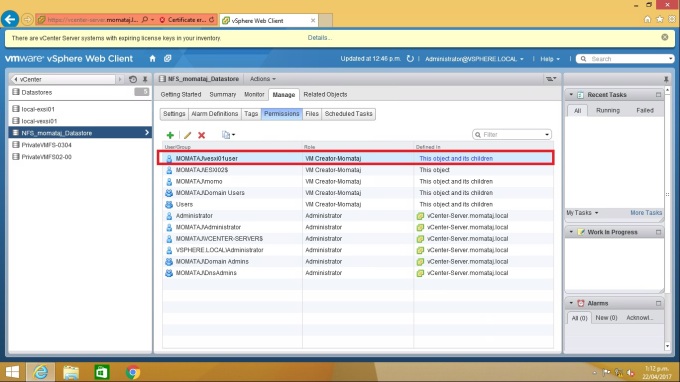
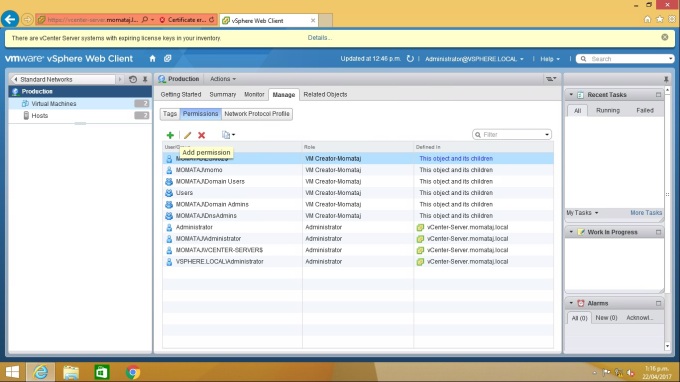
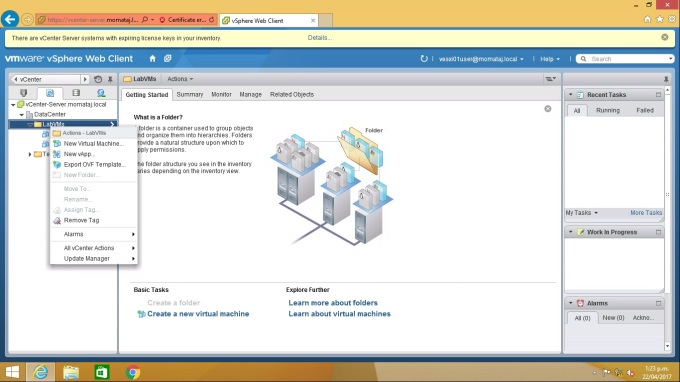
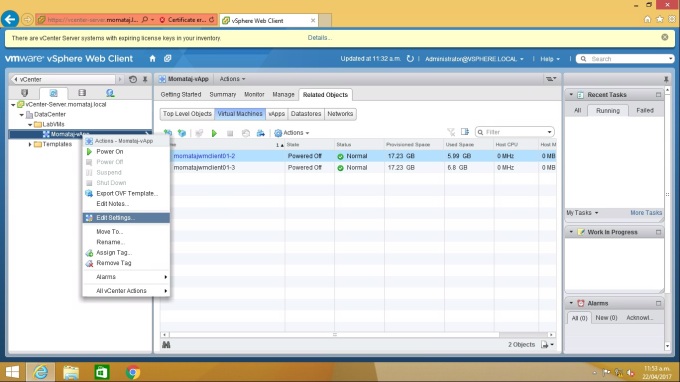
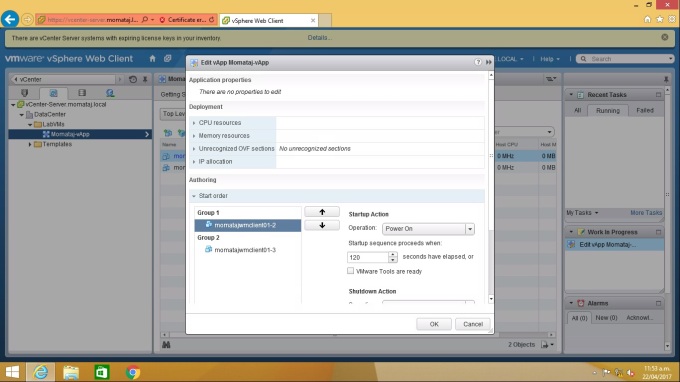
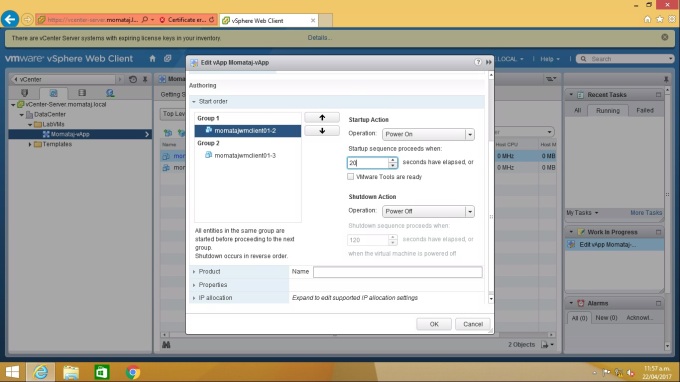
You need to perform the following Actions that I showed on the ScreenShot to modify the cluster settings.
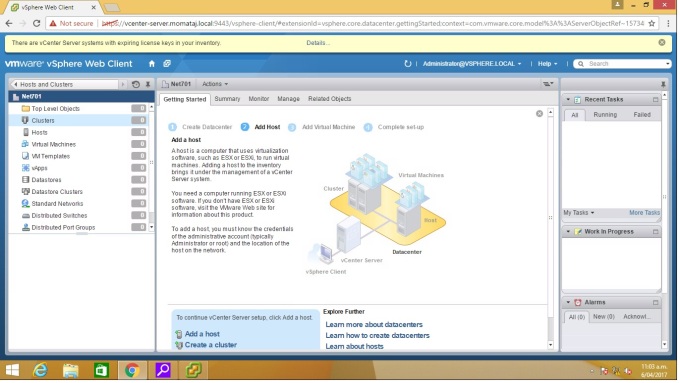
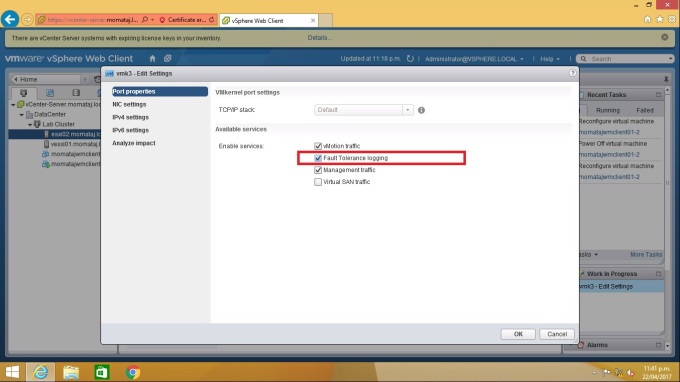
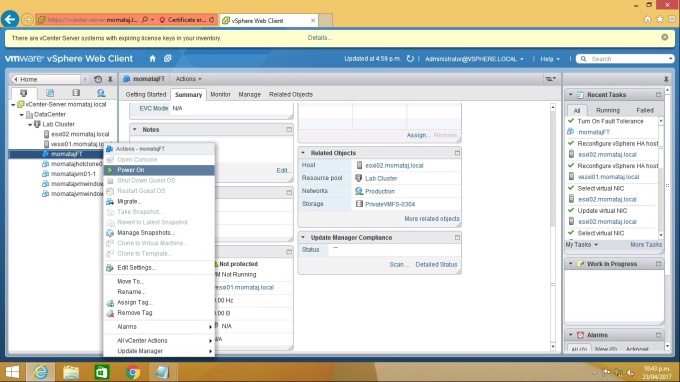
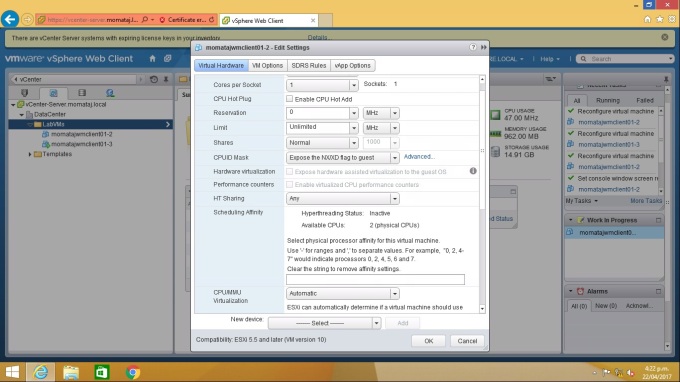
Select Home->Inventory ->Hosts and Clusters. Right click on your lab cluster and select “Edit Settings”
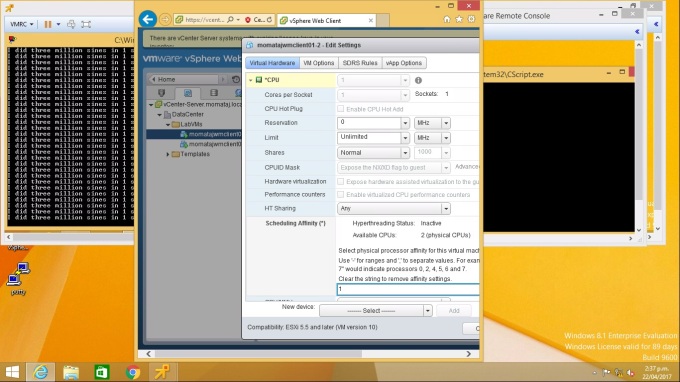
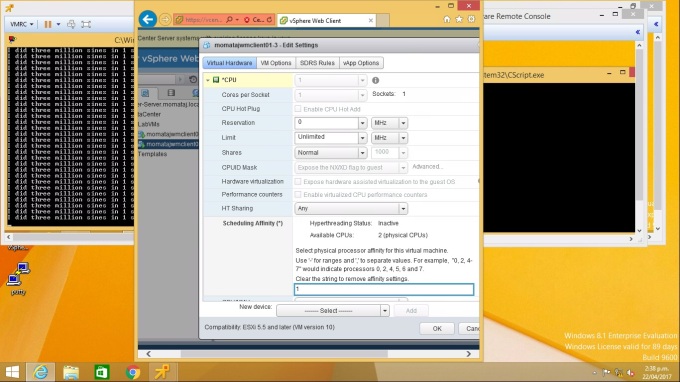
Select “Fully automated” for automation level, it will enable vSphere DRS to migrate VM as required without taking any permission from the administrator.
Now Select the vSphere HA from left panel, Select the “Disable: Allow VM power on Operations that violate availability constraints”
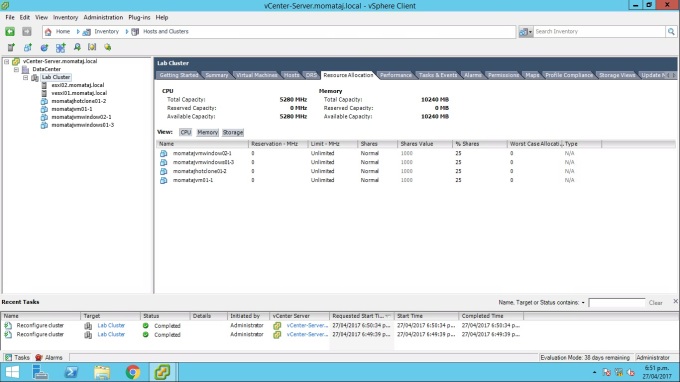
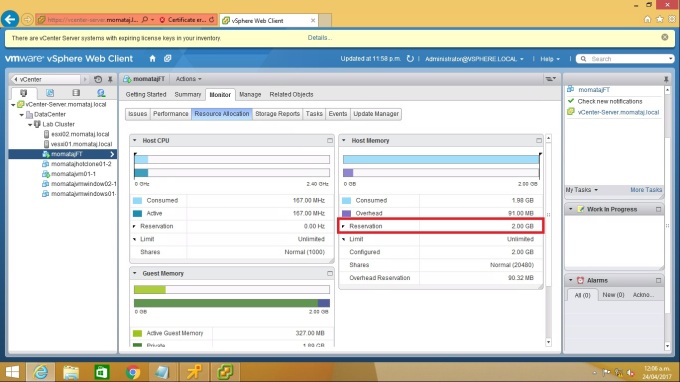
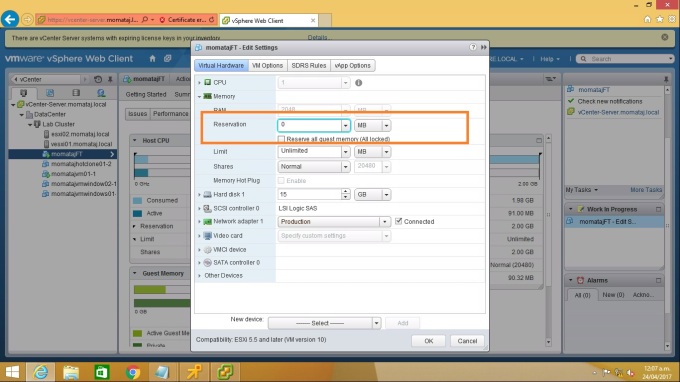
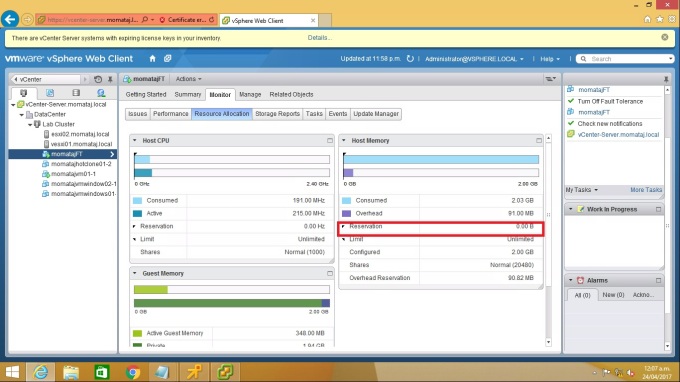
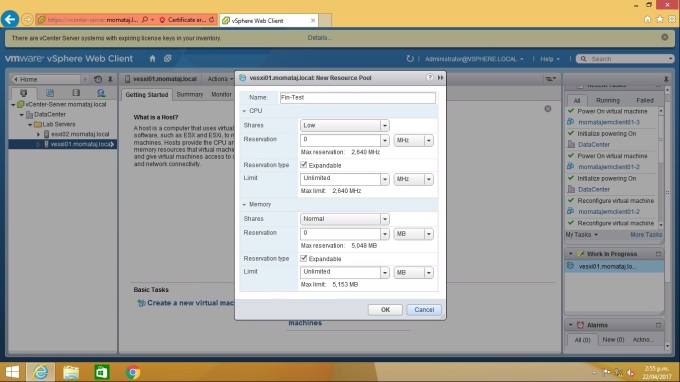
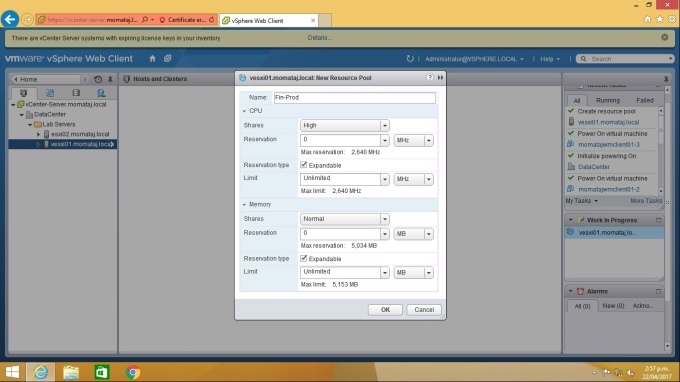
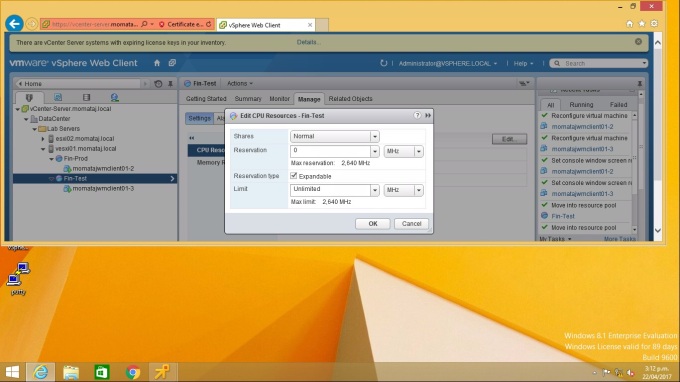
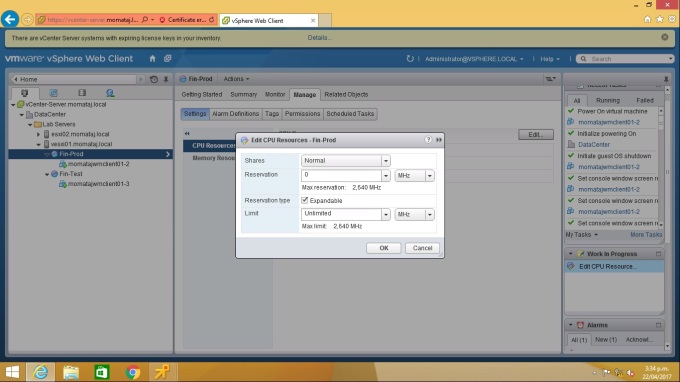
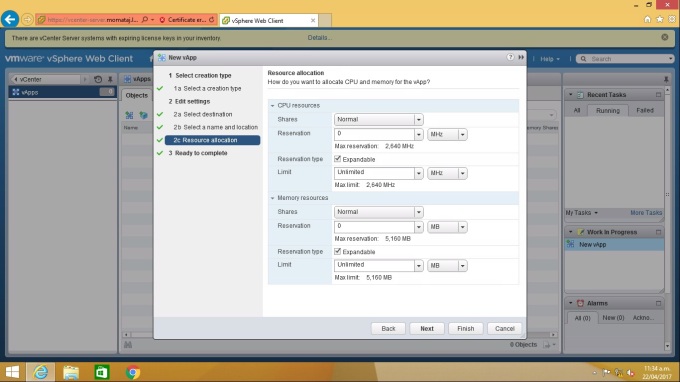
Now you need to go “Resource Allocations” to verify that no CPU and Memory Reservation are assigned to the VMS. If you get any CPU and memory reservations, Edit the setting and put the zero (0) for CPU and Memory Reservation.
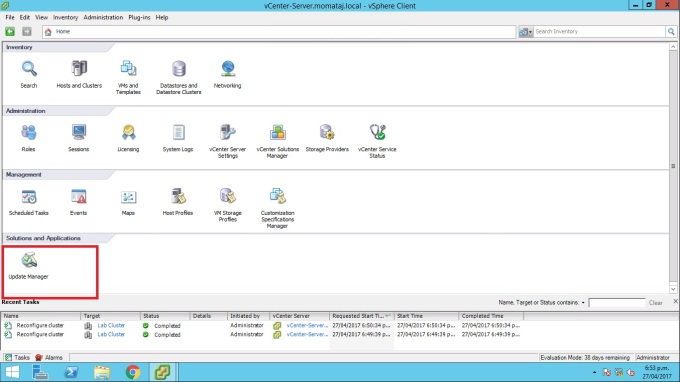
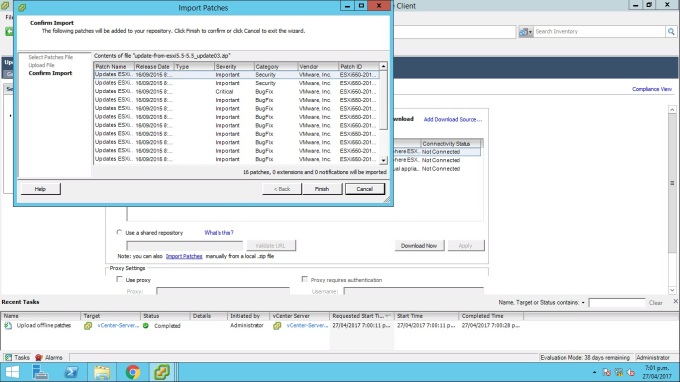
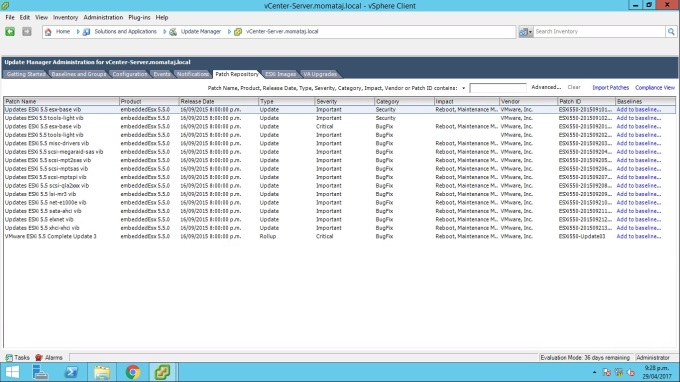
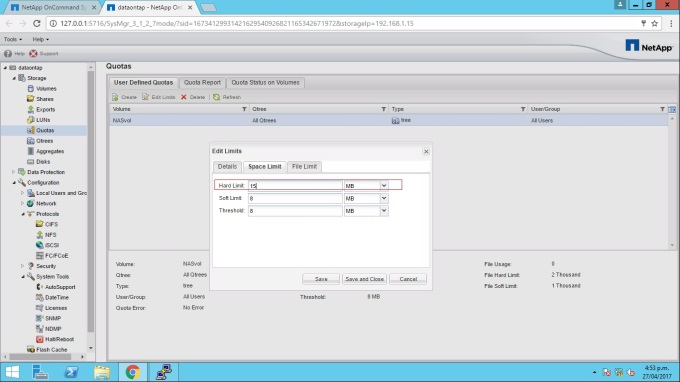
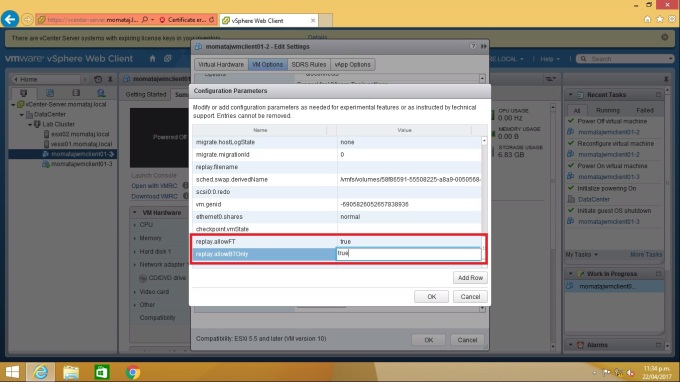
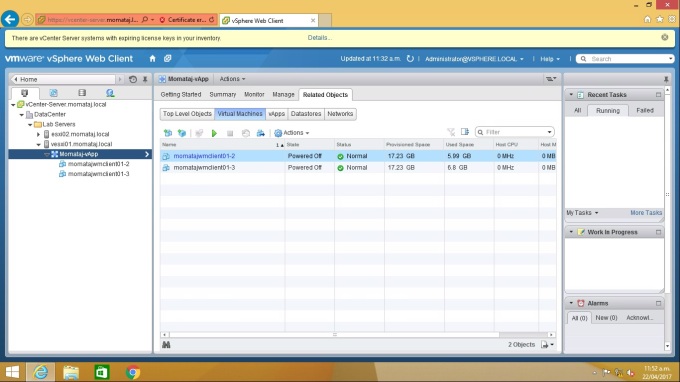
Steps for the task: Configure vSphere Update Manager
In this task, I have shown how to configure vSphere Update Manager by importing patches and extension manually without using a shared repository or the Internet for download.
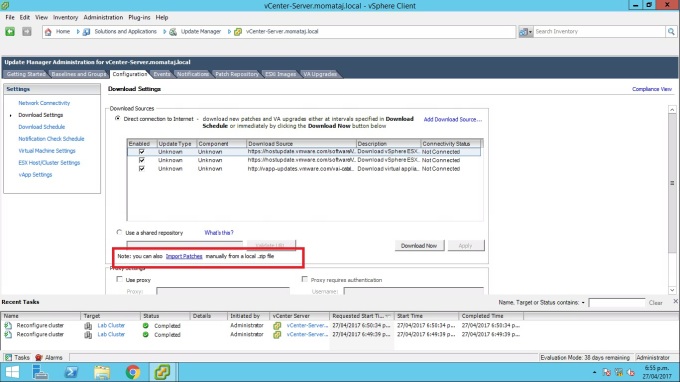
The Configuration Procedure: You need to perform the following actions that I showed on the Screenshot to configure vSphere Update Manager.
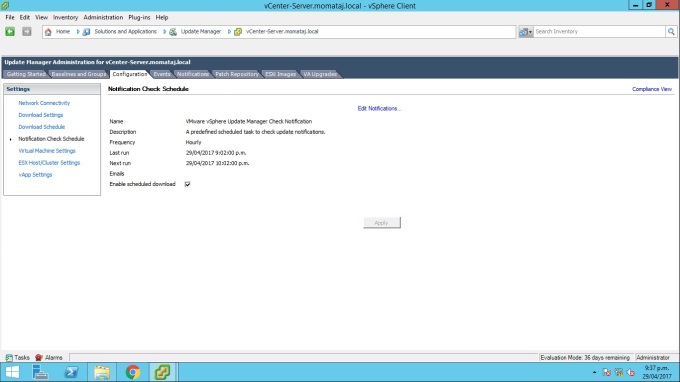
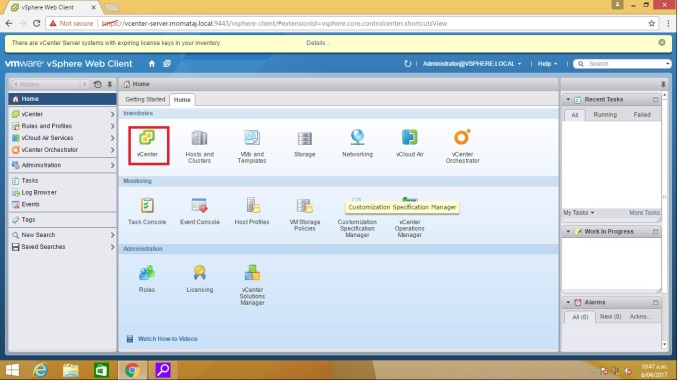
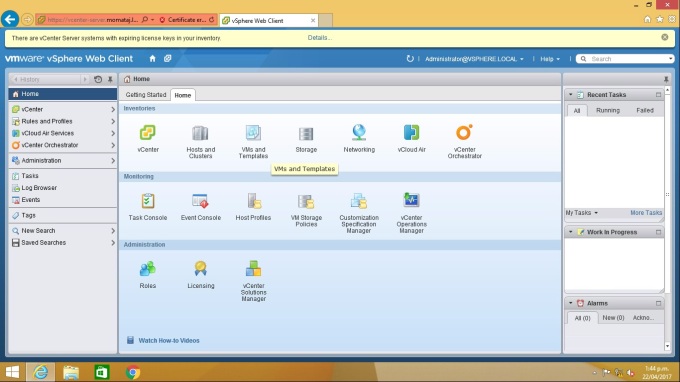
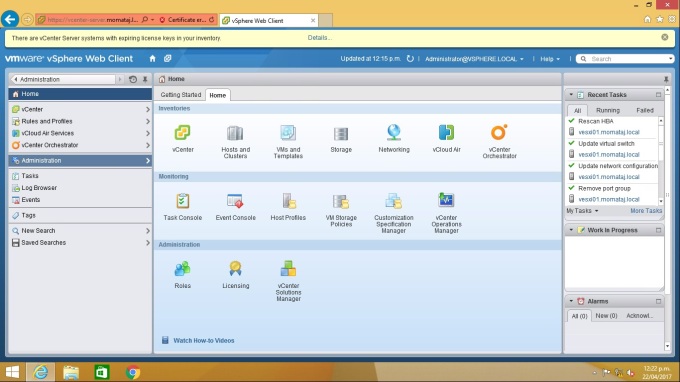
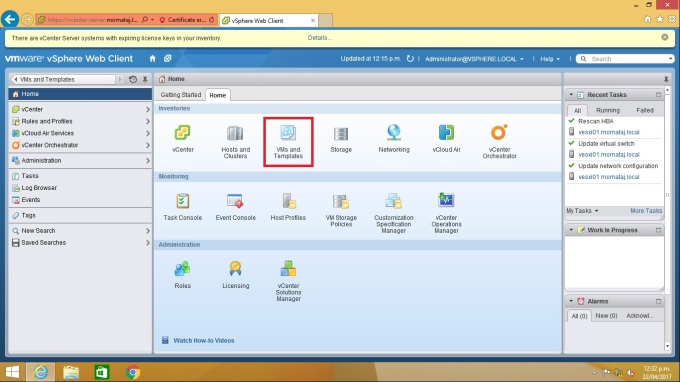
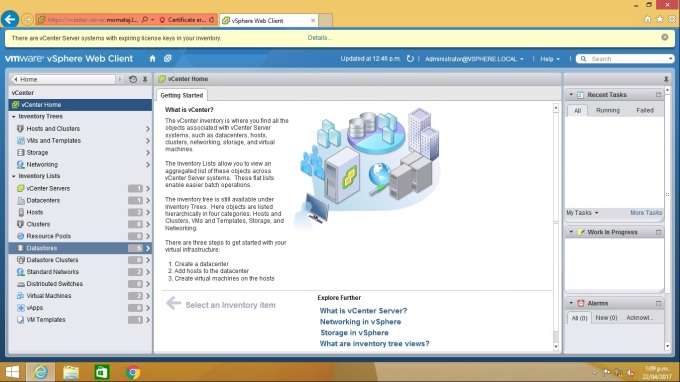
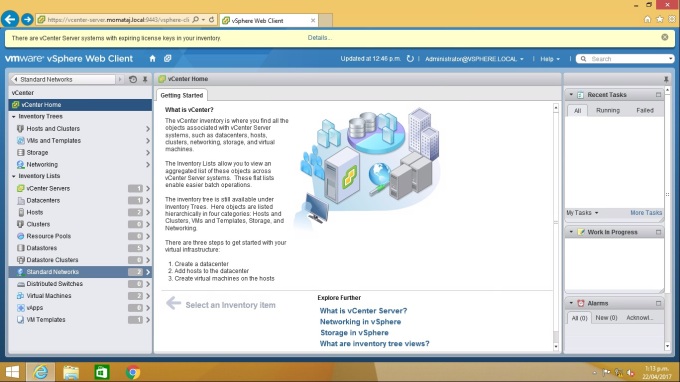
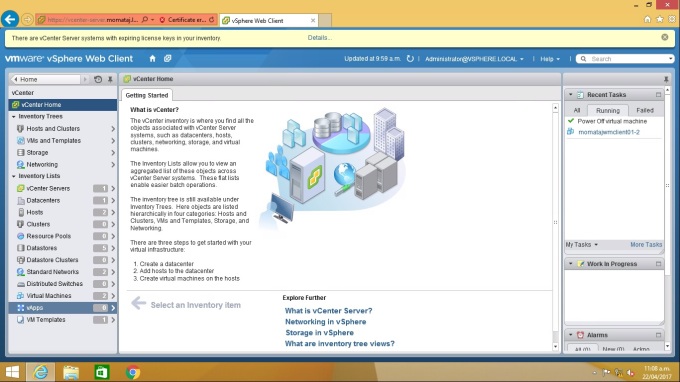
Go to the Home -> Solution and Application -> Update Manager
Go to the Configuration tab, click “Download Setting” link.
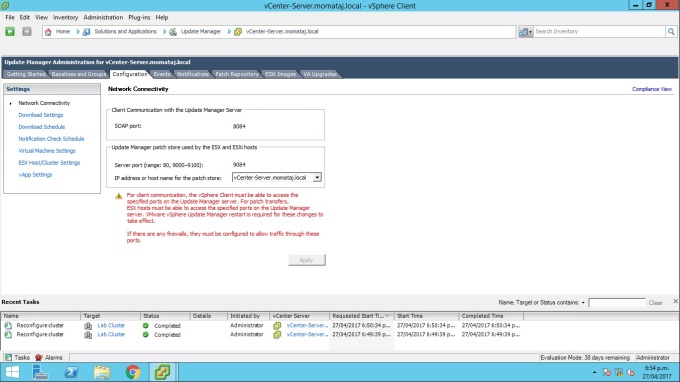
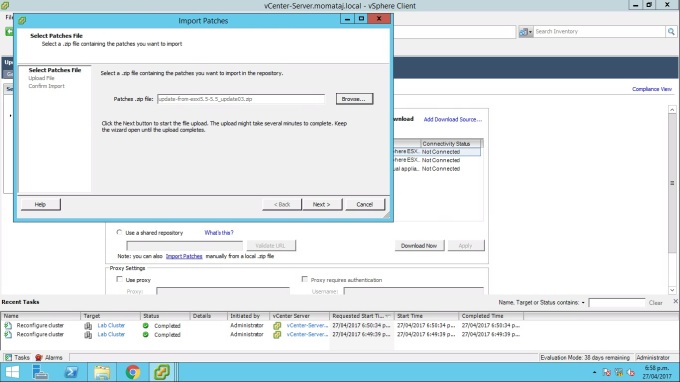
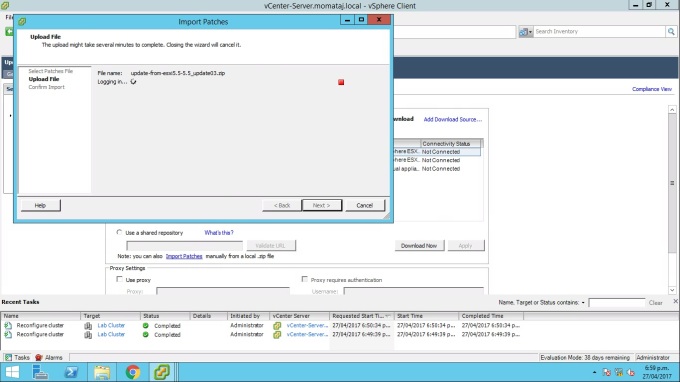
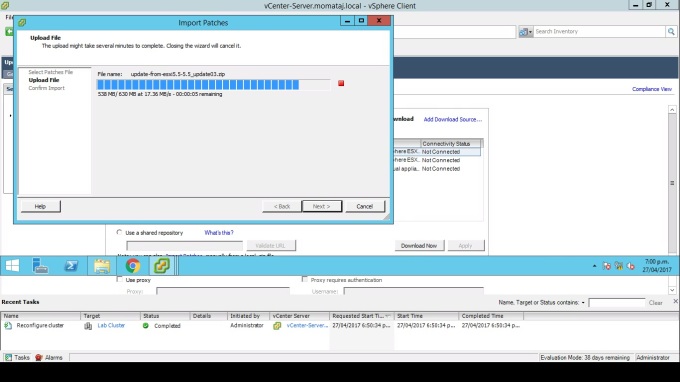
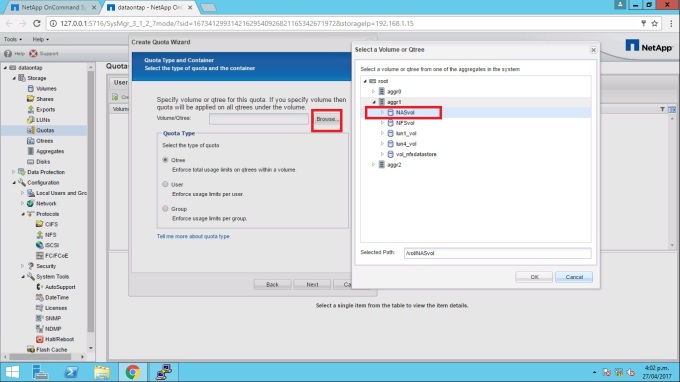
Click “Import patches link” that your instructor provided you. Click Browse and select the location of the “Import patches”
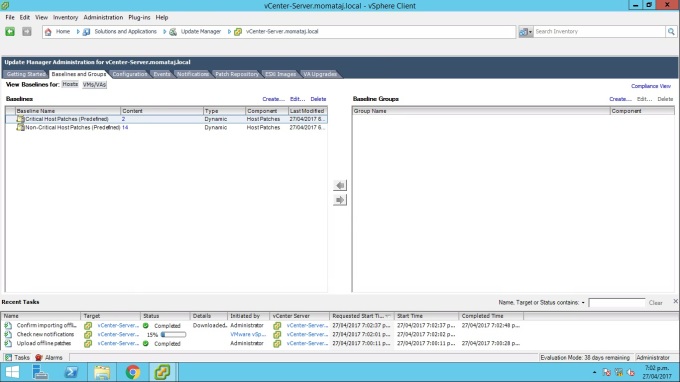
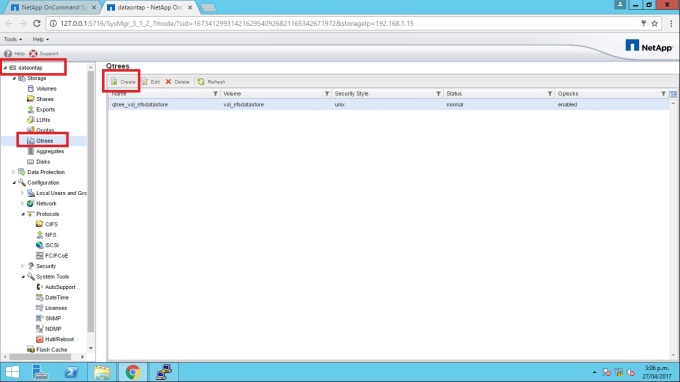
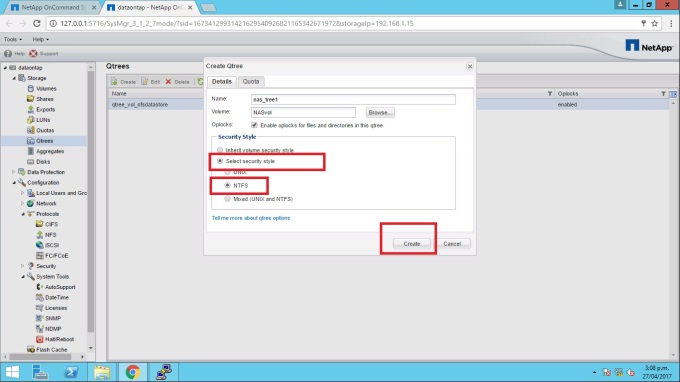
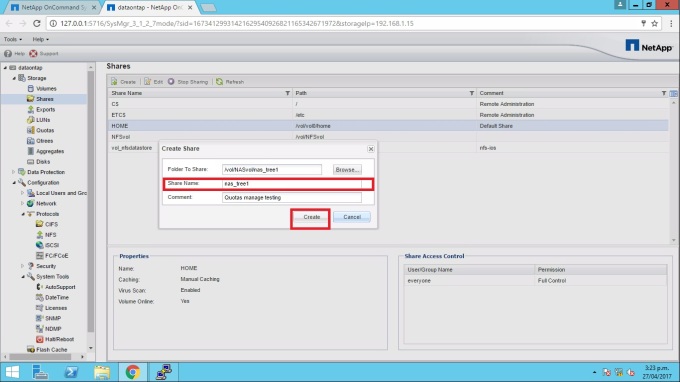
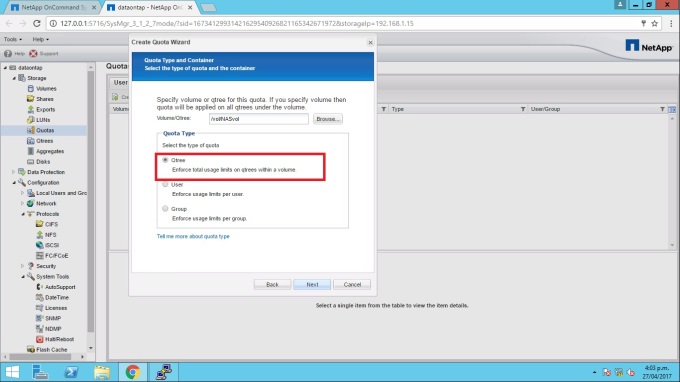
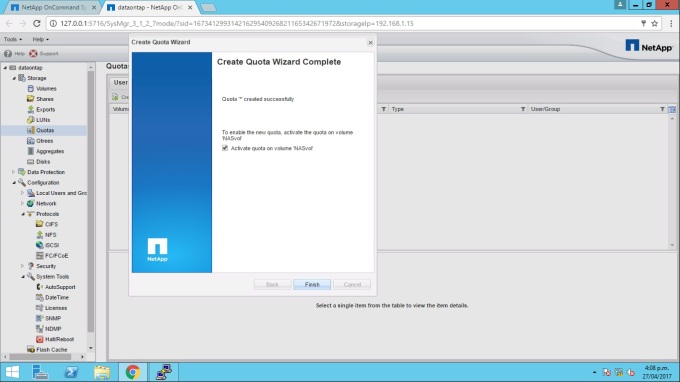
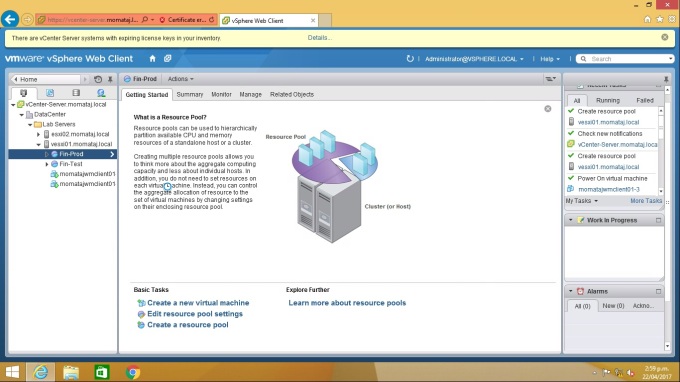
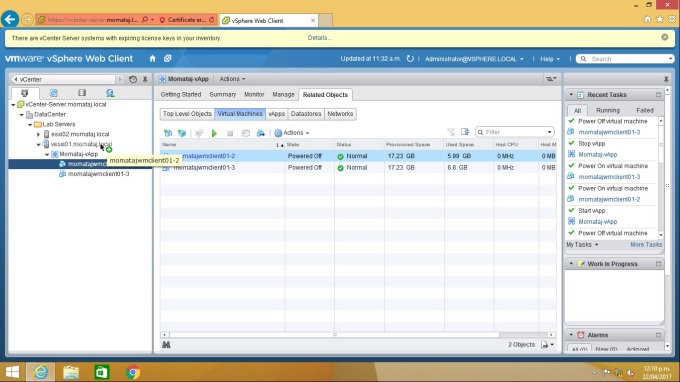
Steps for the task: Create a Patch Baseline
In this task, I showed how to create a patch baseline on the screenshot. Baselines contain a collection of one or more patches, extension, or upgrades for the vCenter Server system
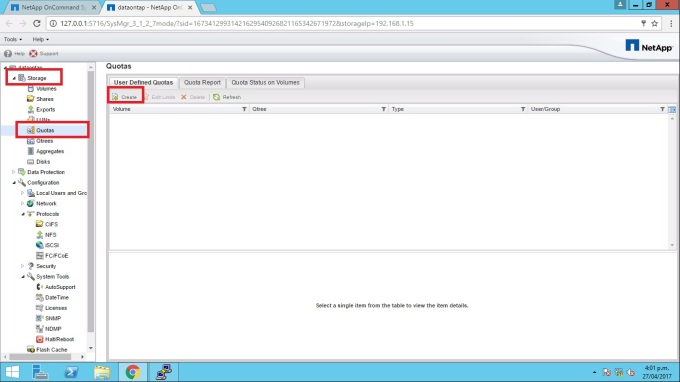
The Configuration procedure: You need to perform the following action to create a patch baseline step by step.
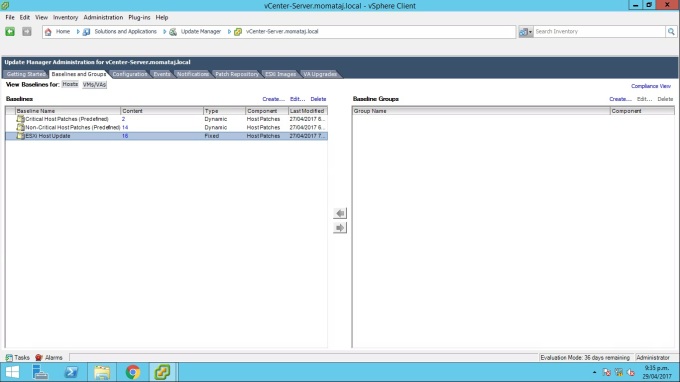
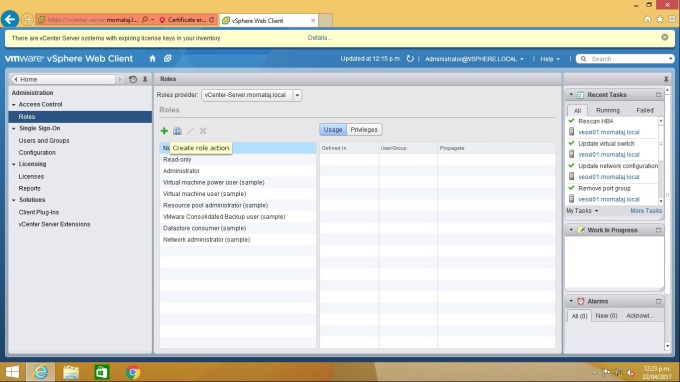
Click Baseline and Groups tab. You will see there is two by default “Create” link. One is under Baseline and another is under Baseline Group panel.
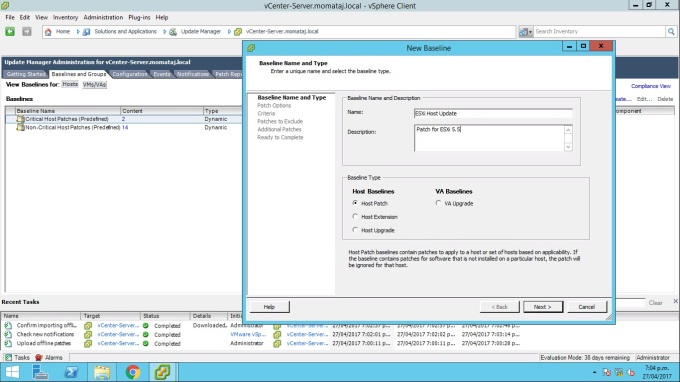
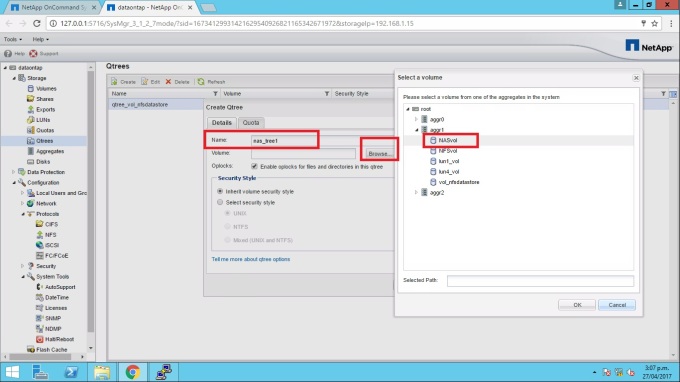
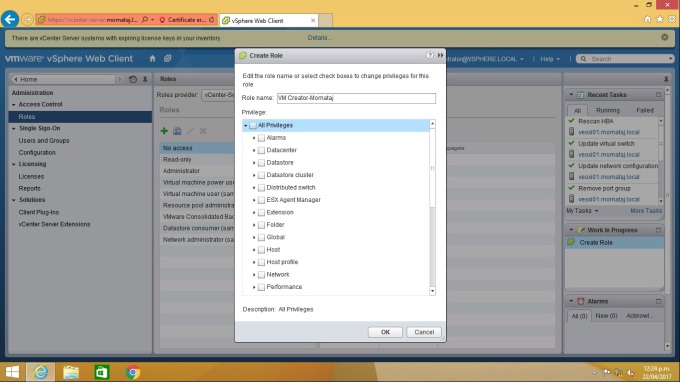
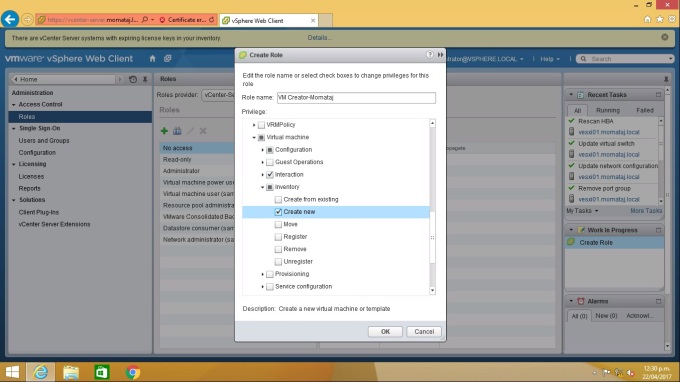
In this section, I am going to show how to create new Baseline. Click “Create” from Baselines Groups section.
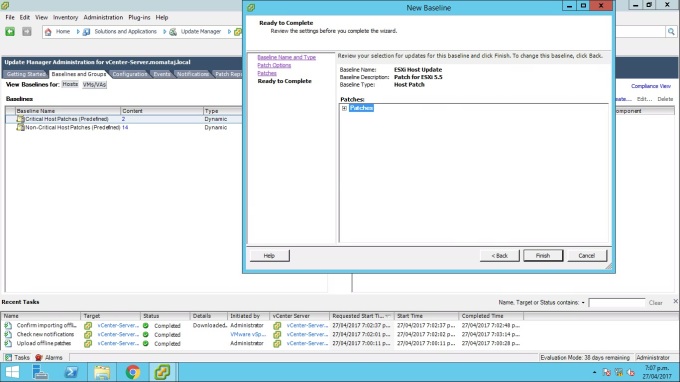
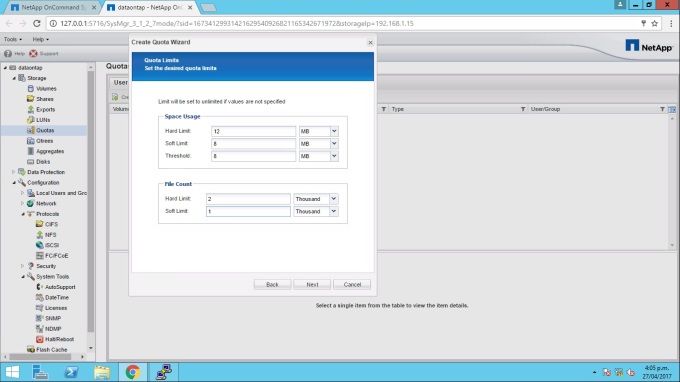
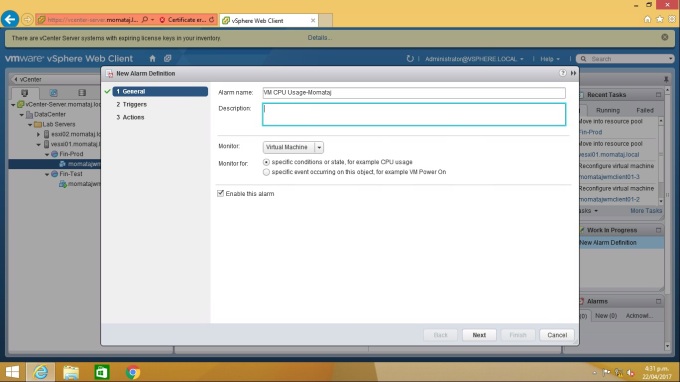
Name the Baseline and Description
Name: ESXi Host Update
Description: Patch for ESXi 5.5
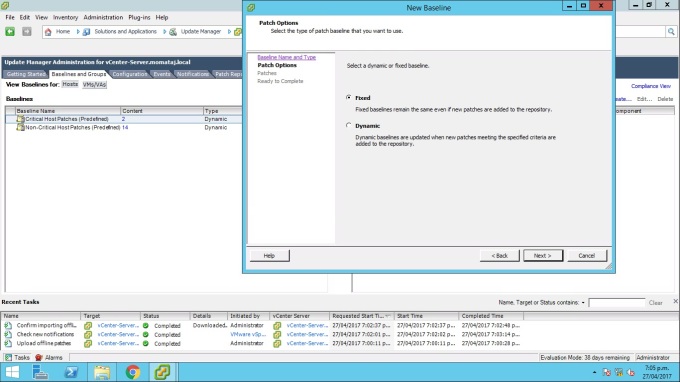
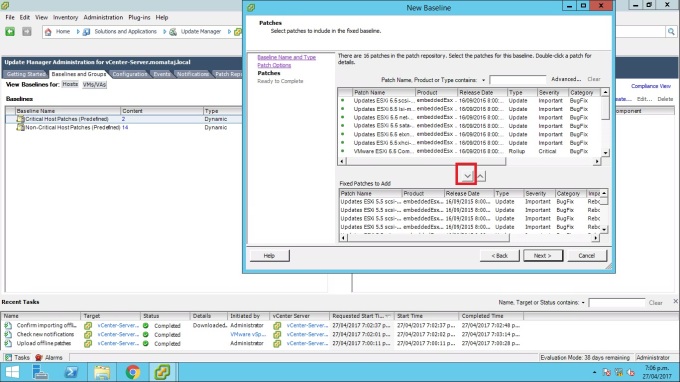
Select the patch Option “Fixed“. If you select “Fixed” the baseline will remain same even after you update the patches to the repository.
Select all of the patches and click the down arrow that I pointed by red colour under the horizontal scroll bar to add the patch to the fixed patches to add pane.
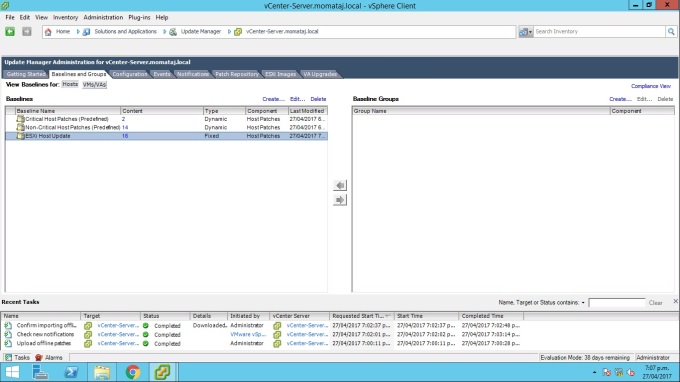
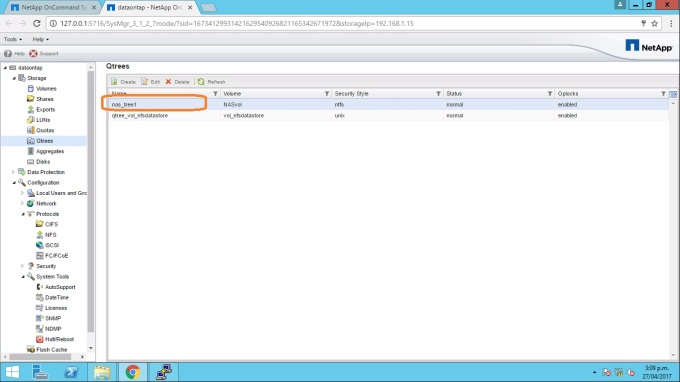
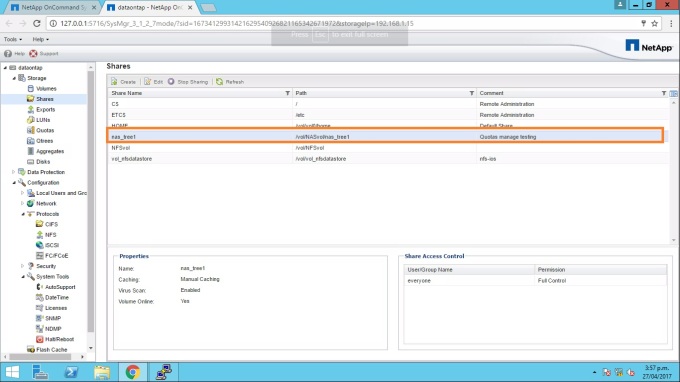
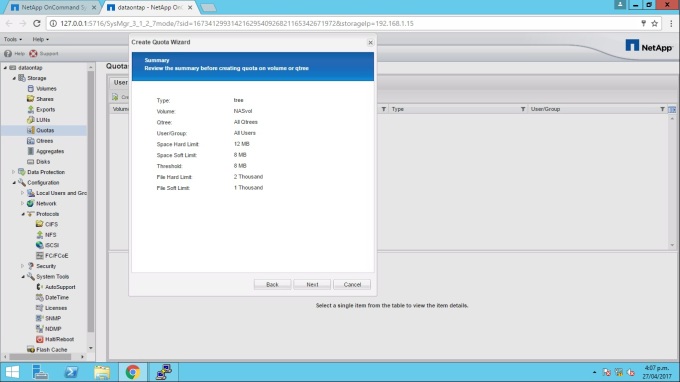
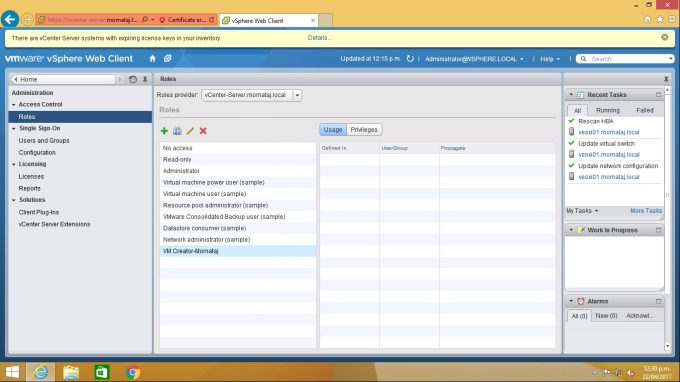
Now you can a new patch “ESXi host Update” has created with two default baselines
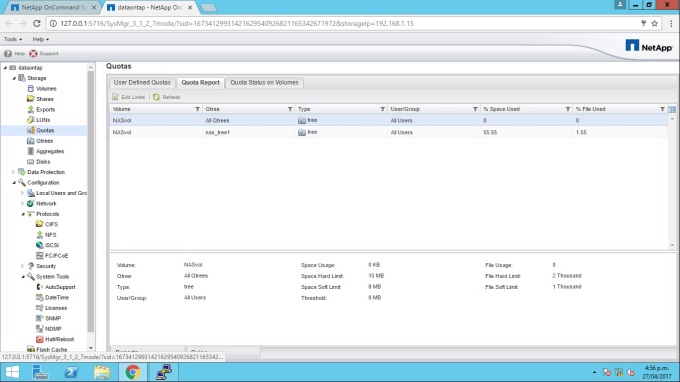
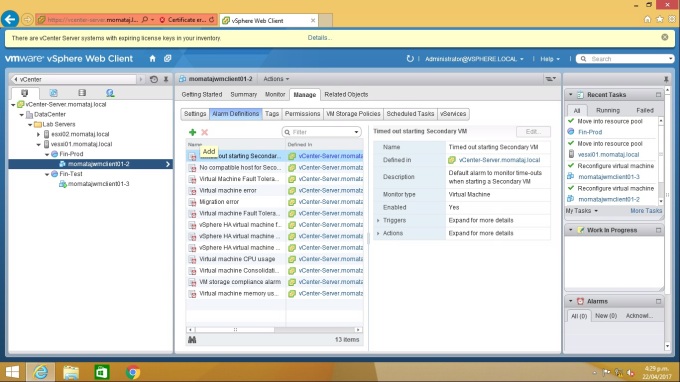
Steps for the task: Attach a Baseline and Scan for Updates
In this task, I used scanning process for patching the attributes of hosts in my system.
The Baseline Attach procedure: You need to follow the following steps for attaching a baseline and Scan for updates in your cluster.
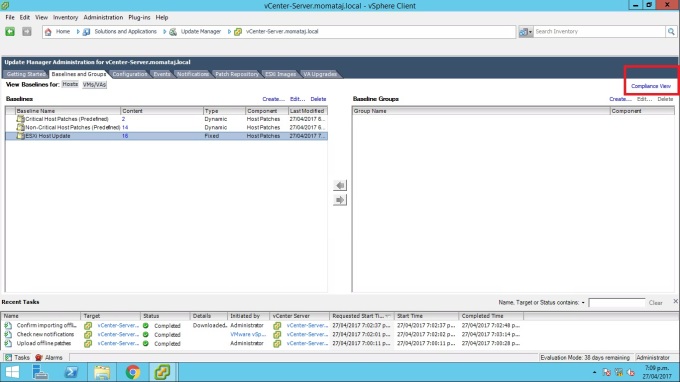
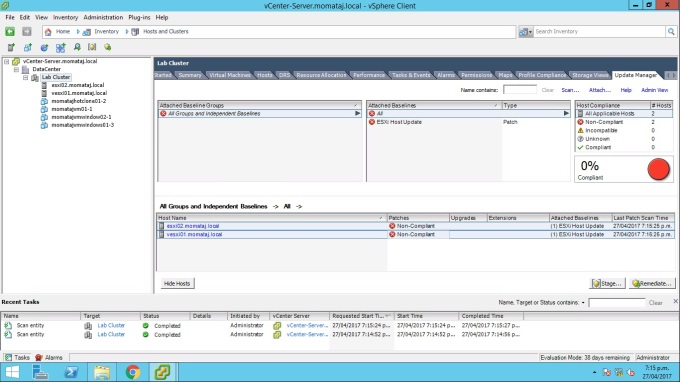
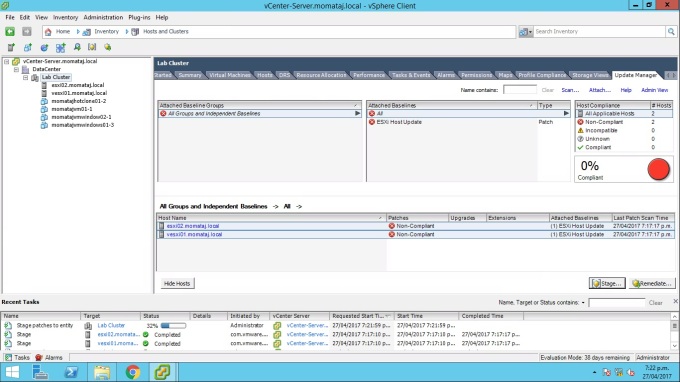
Click the “Compliance view” at the upper-right of the Baseline and Groups tab.
Select the “Lab Cluster” from the vCenter Server inventory and Click the “Update Manager” and select “Attach” link.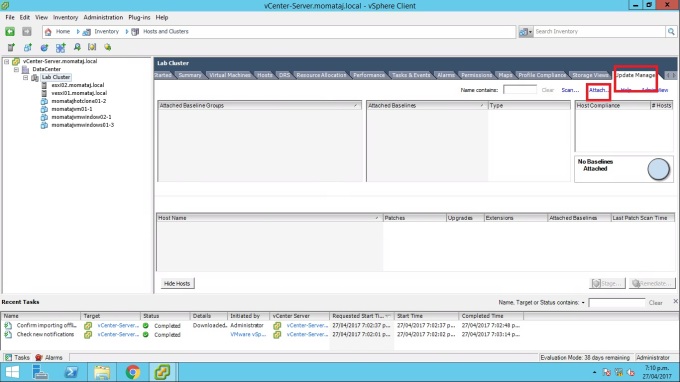
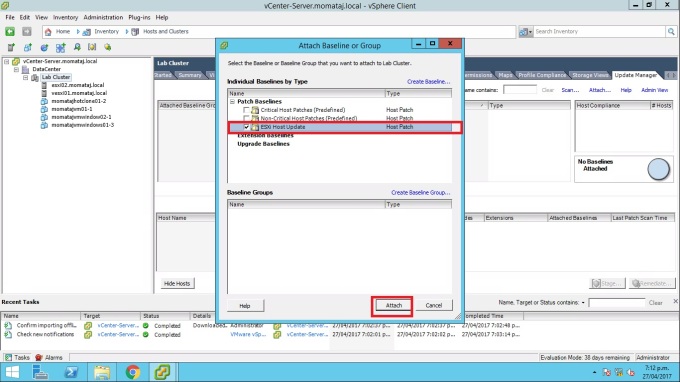
Now you will get “Attach Baseline or Group” wizard. Select the “ESXi Host Update” patch Baselines that you created the previous task.
Now click the “Scan” link under Update Manager tab in the lab cluster
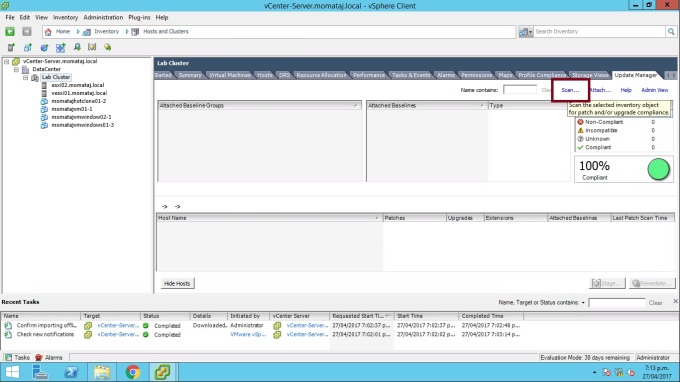
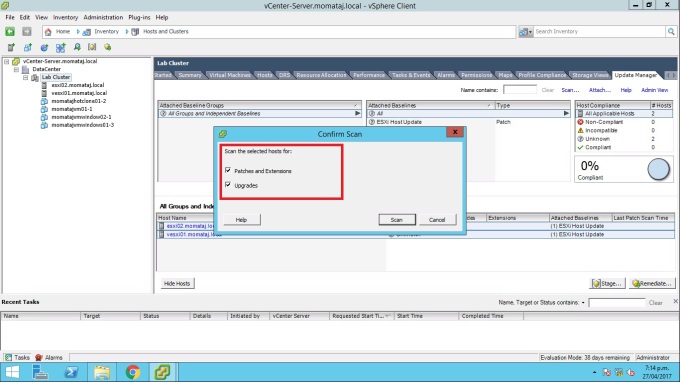
After “Scan” is complete, the result should be ESXi hosts are “Non-Compliant”. 0% compliant.
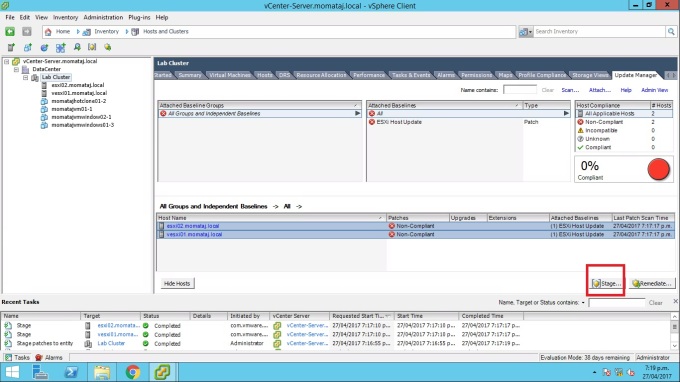
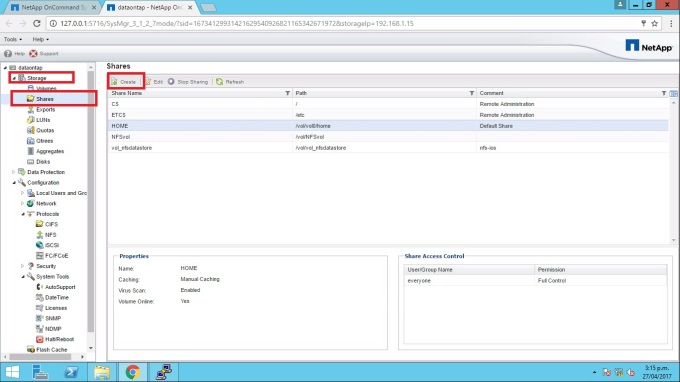
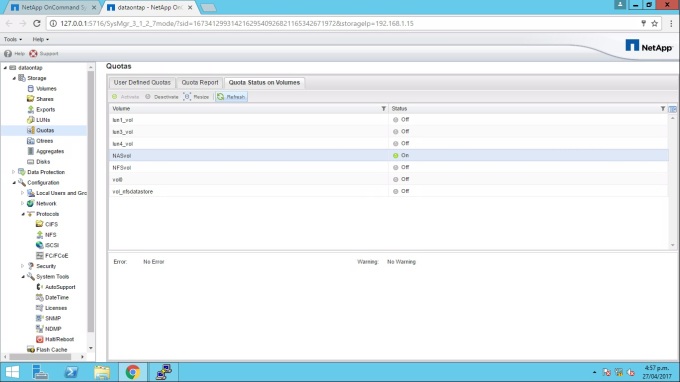
Steps for the task: Stage the Patches onto the ESXi Hosts
Staging patches and extensions speeds up the remediation process because patches and extensions are already available locally on the hosts.
The Configuration Procedure: I showed the configuration procedure step by step on the screenshot. You need to perform the following action.
Select the ESXi host from “All Groups and Independent Baselines” under “Update Manager” and Click “Stage”. Note: do not select the ESXi host from the lab cluster.
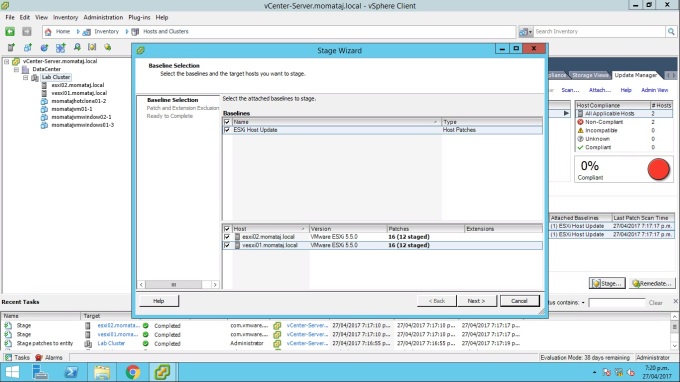
Now you need to perform the following action that showed on the Stage wizard.
Baseline: ESXi Host Updates
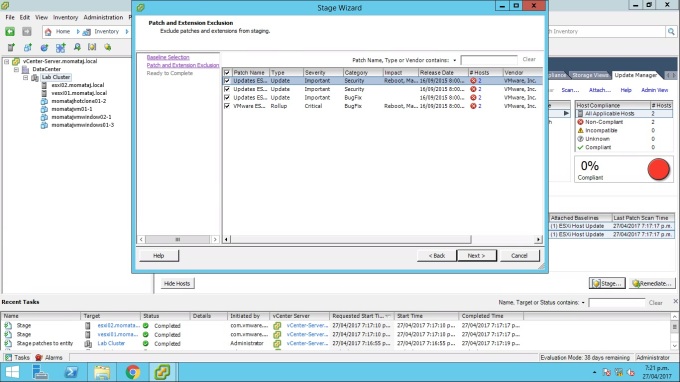
Select all patch and extension Exclusion in the box and click Next
Monitor the Stage patch configuration from the “Recent task”
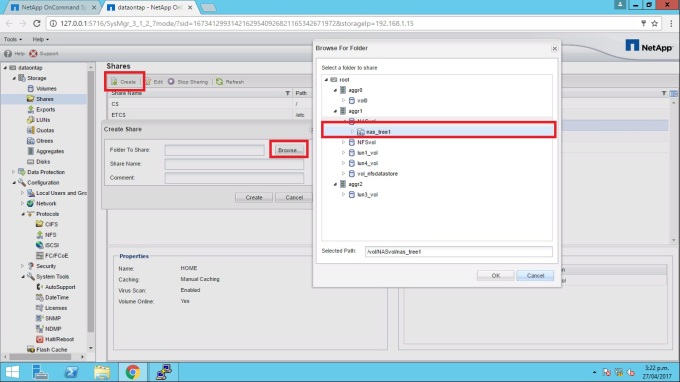
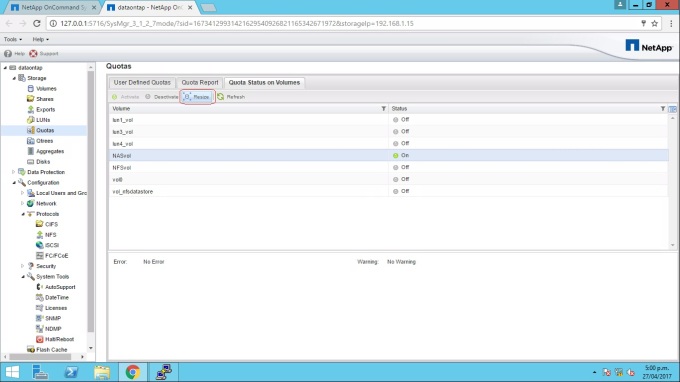
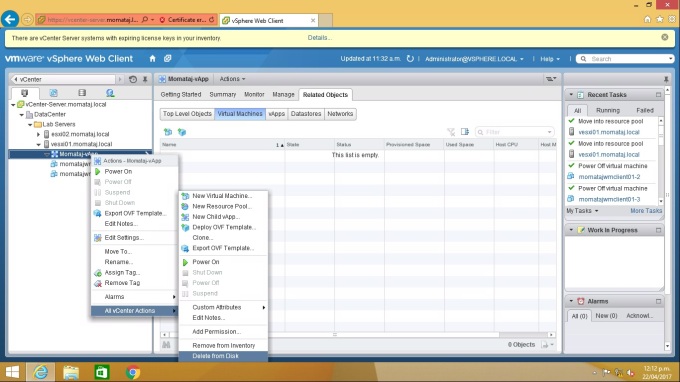
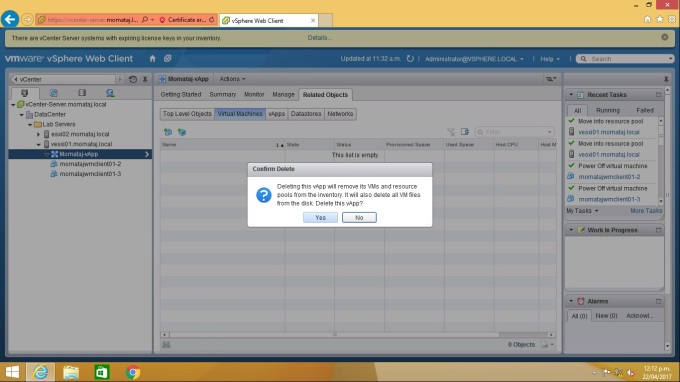
Steps for the task: Remediate the ESXi Hosts
Remediation of hosts in a cluster requires that VMware vSPhere Distributed Power Management and VMware vSphere HA admission control are temporarily disabled.
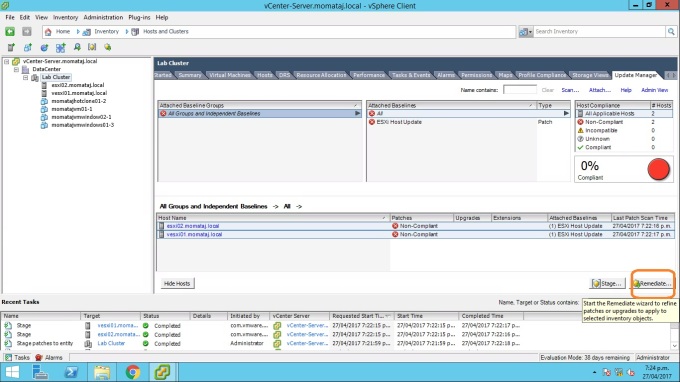
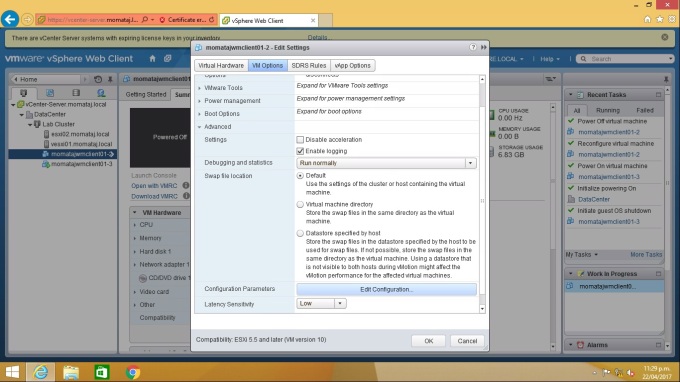
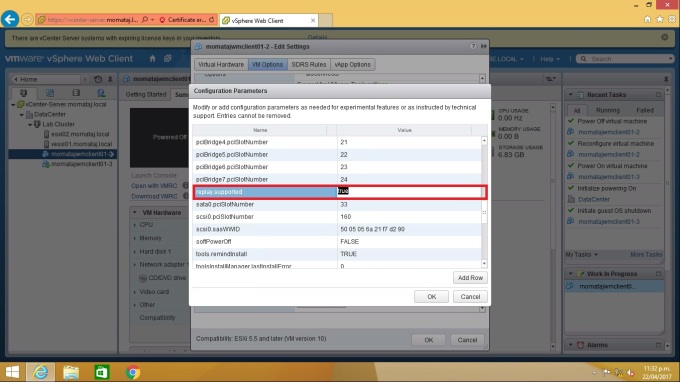
The Remediate the ESXi Hosts Configuration procedure: I showed on the screenshot how to remediate the ESXi host, you need to perform the following actions for configuring the remediate.
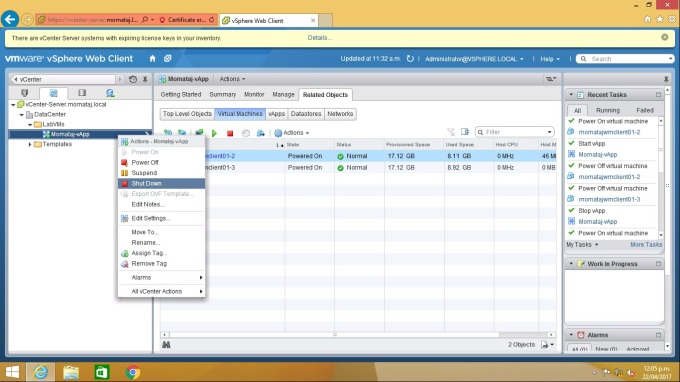
Go to the “Lab Cluster” and Click the “Update Manger” tab. Click the “Remediate”.
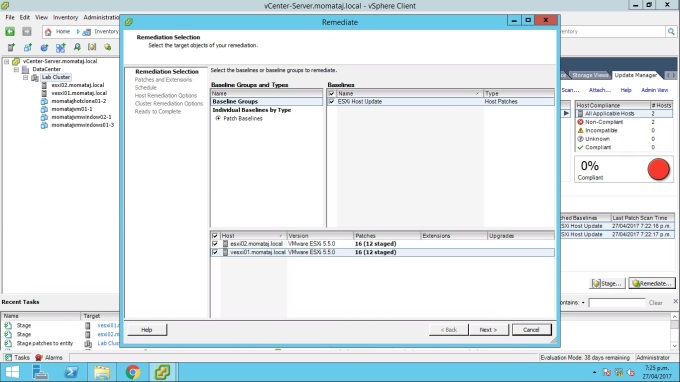
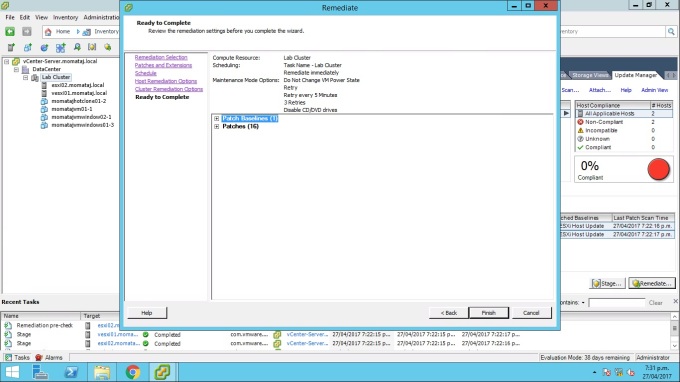
In the Remediate wizard, perform the following action.
Remediation selection: leave it to default
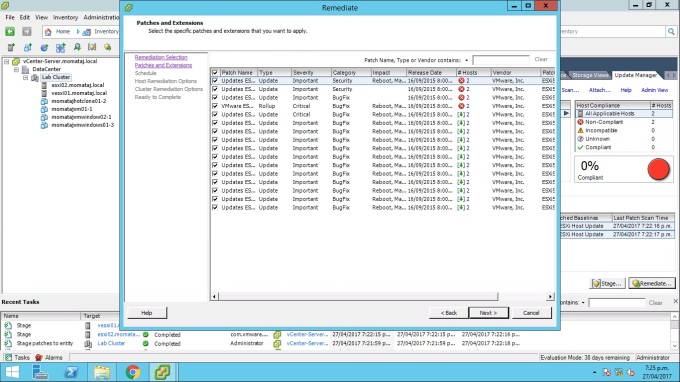
Patches and extension: leave it to default if all is already selected.
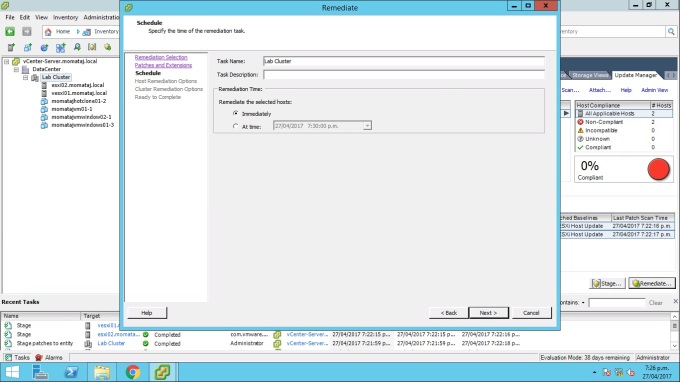
Schedule: Name: Lab Cluster [ The cluster name will be showed automatically]. Leave the page default and click “Next”
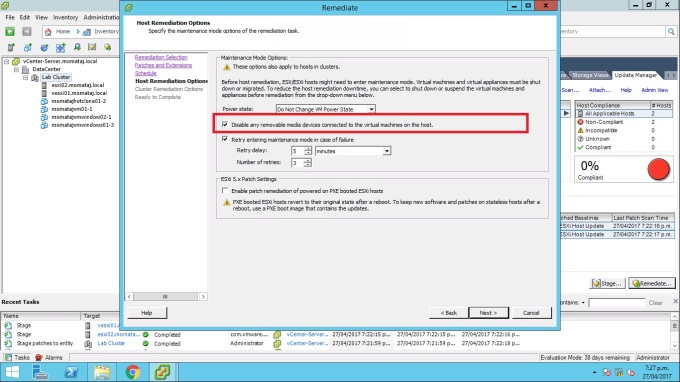
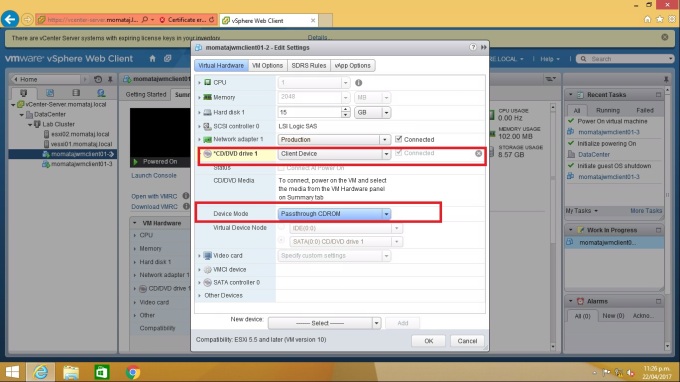
Host remediation Option: Select “Disable any removable media devices connected to the virtual machines on the host” and leave other settings default. Click “Next”
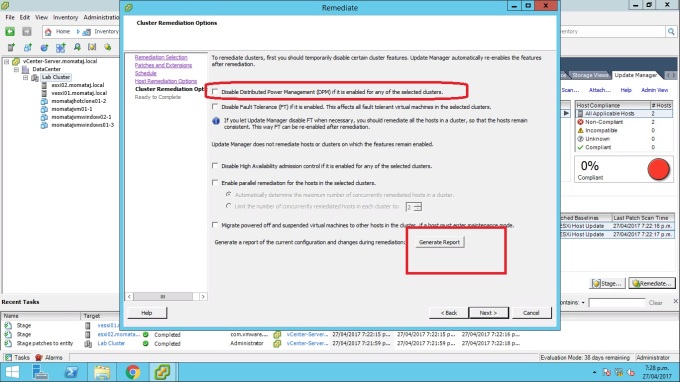
Cluster Remediation Options: Deselect: Disable Distributed power management (DPM) if it is enabled for any of the selected clusters.
Now click “Generate Report” to identify the task list that remediation process will perform.
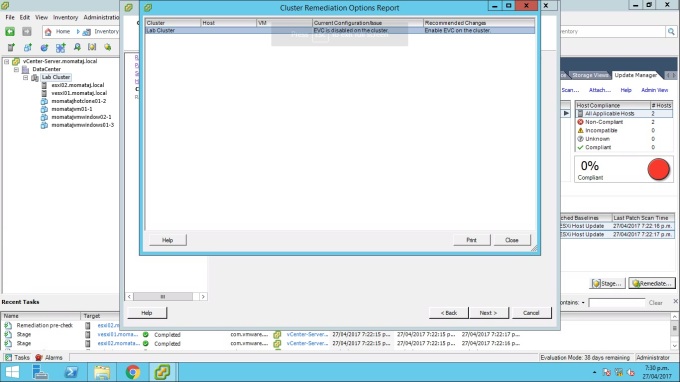
“Lab cluster” task will be performed by remediation process.
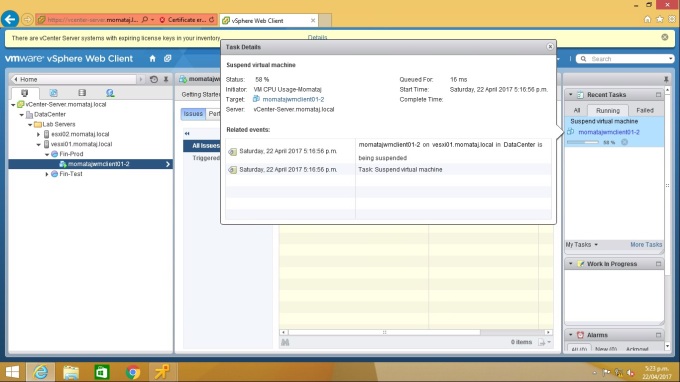
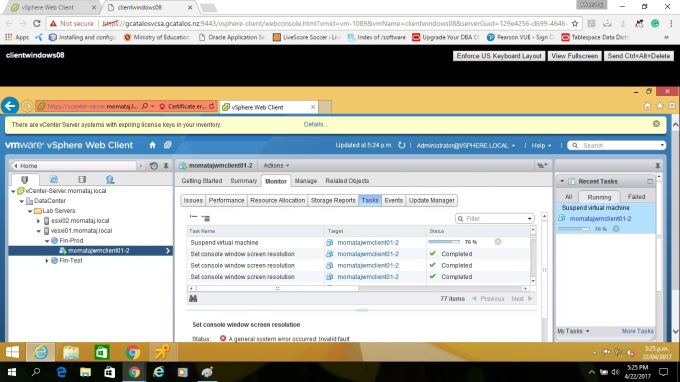
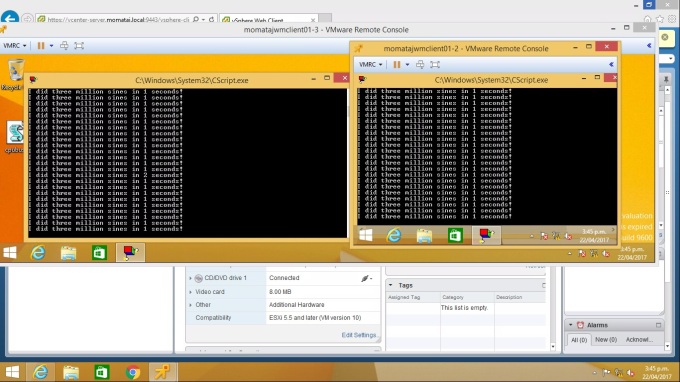
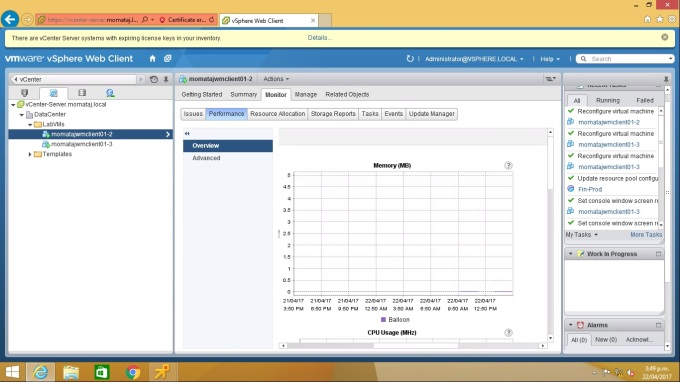
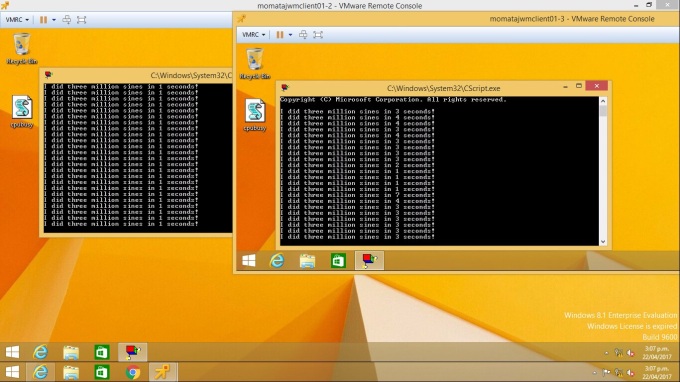
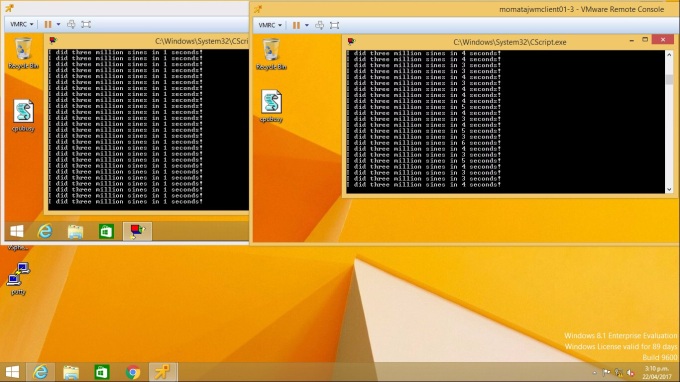
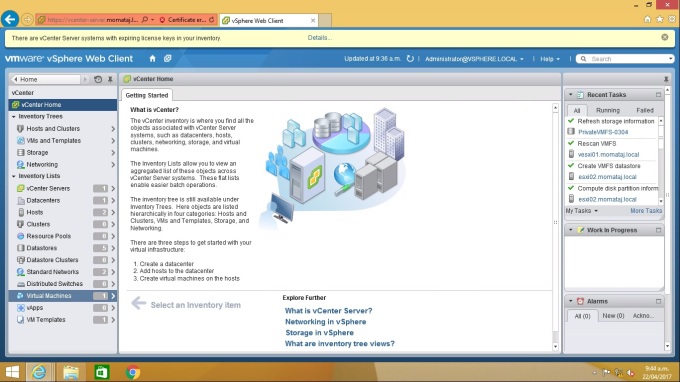
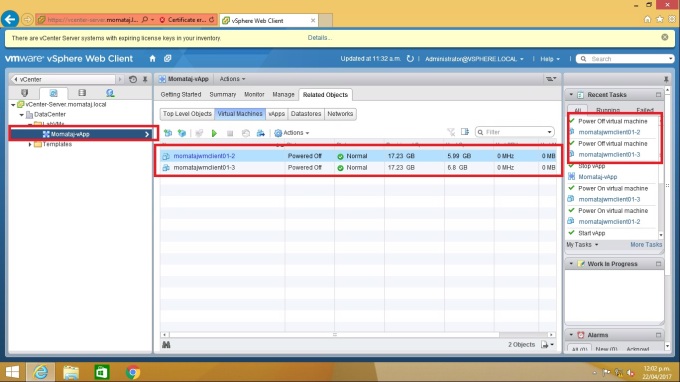
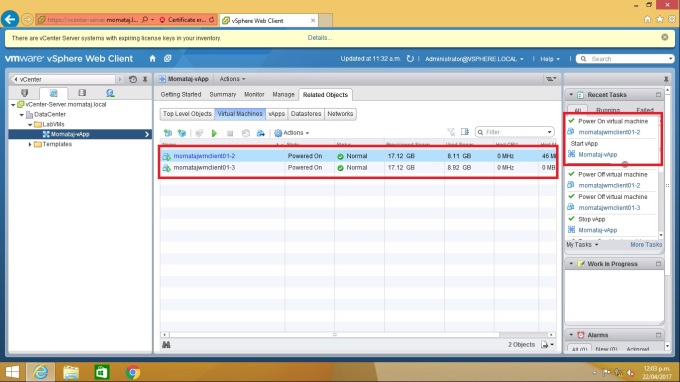
Monitor the progress of the lab cluster task that is performing the remediation process from the “Recent Tasks” bar.
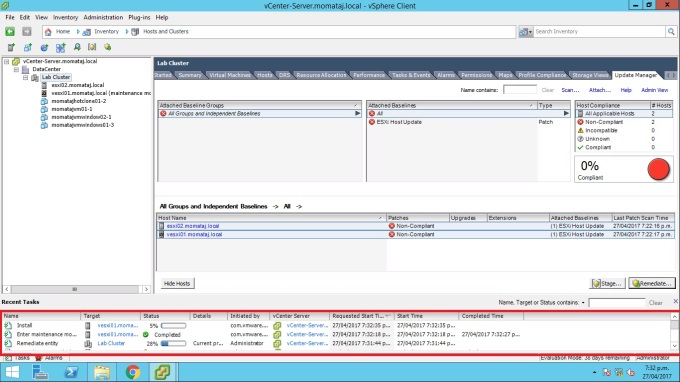
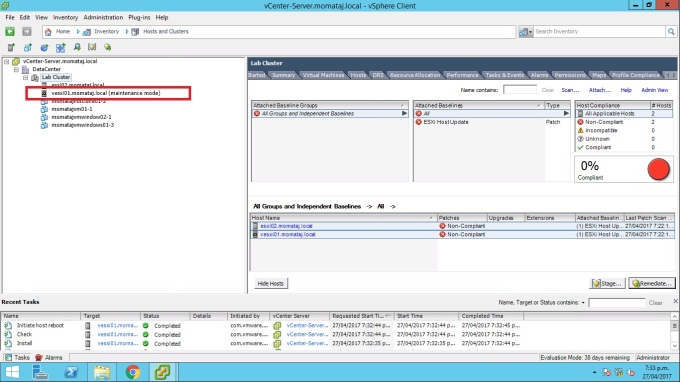
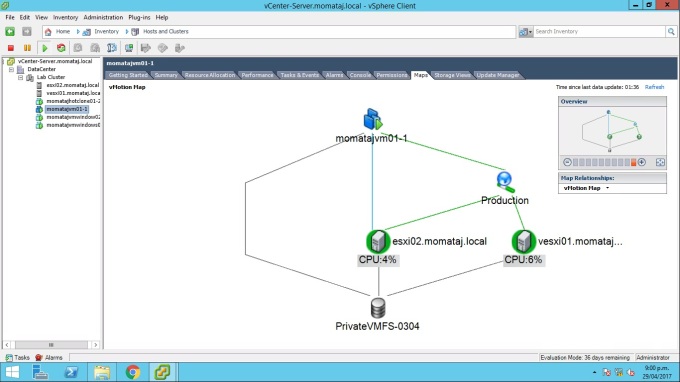
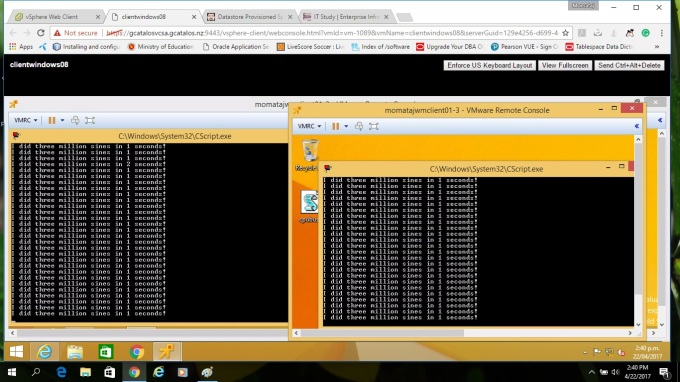
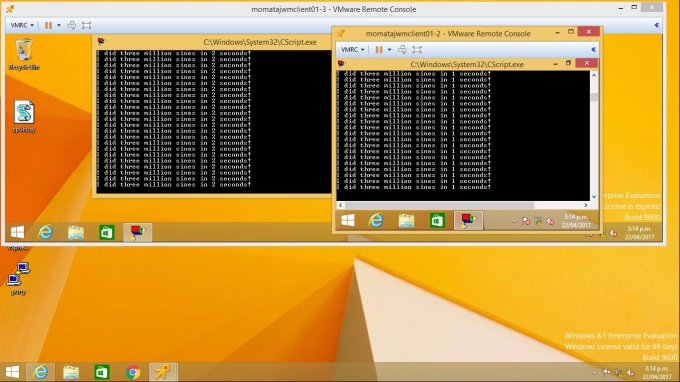
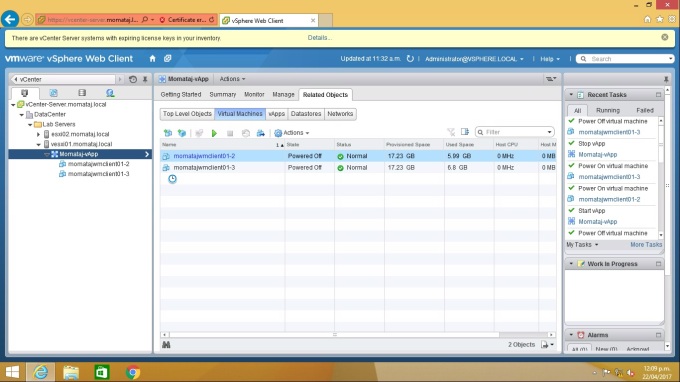
You will see the EXSI host placed into the maintenance mode during the remediated process if you check the progress.
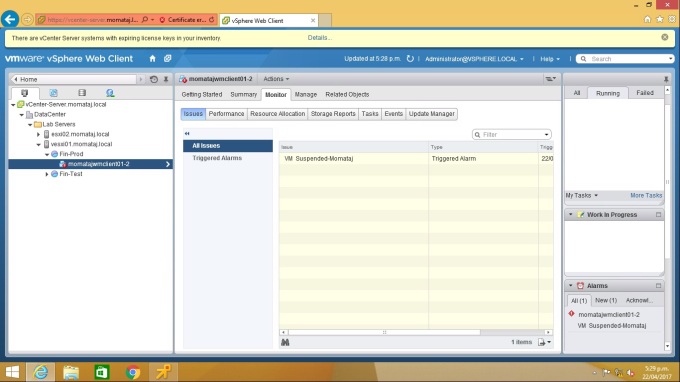
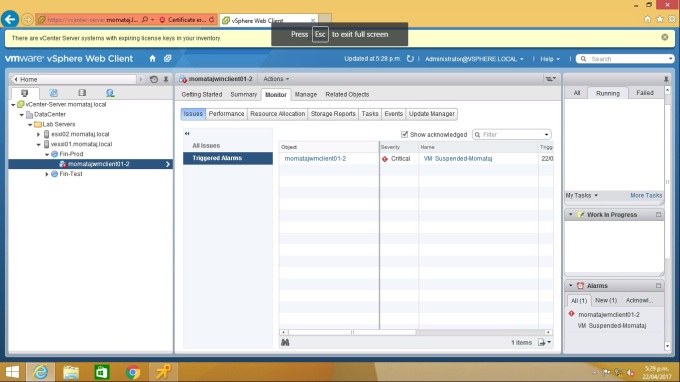
Note: If you have any power-on VMs under the maintenance host, they will migrate to the other node in the cluster. Any powered-off VM will not migrate.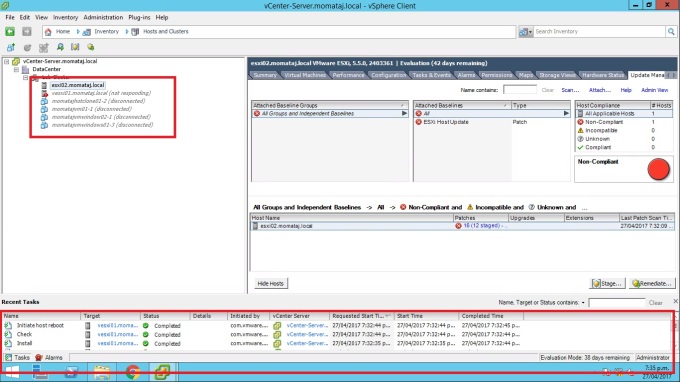
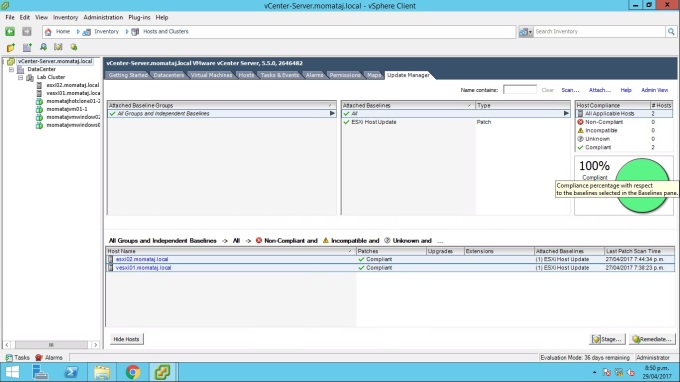
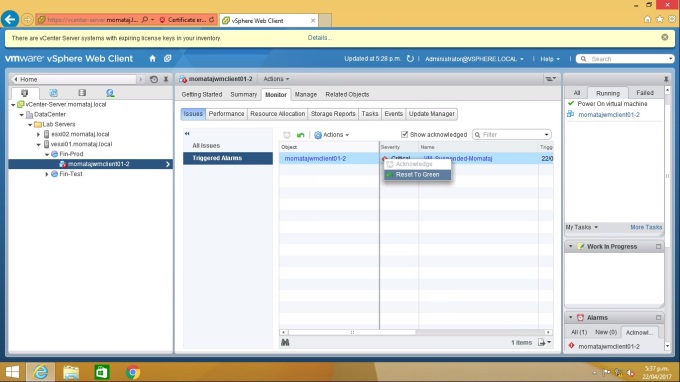
You will see the hosts in the lab cluster show 100 % compliance when the remediation process complete. Status: Compliant and the red circle will show “Red”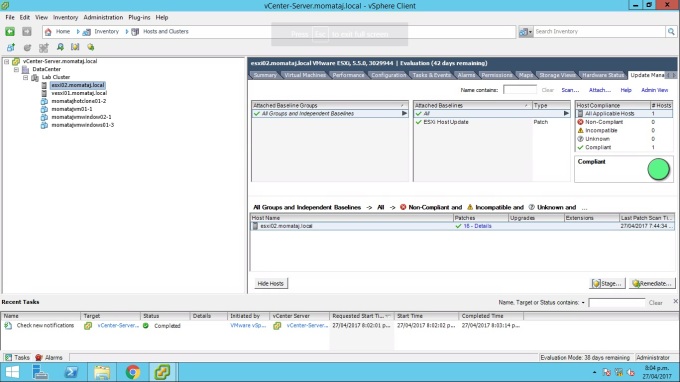
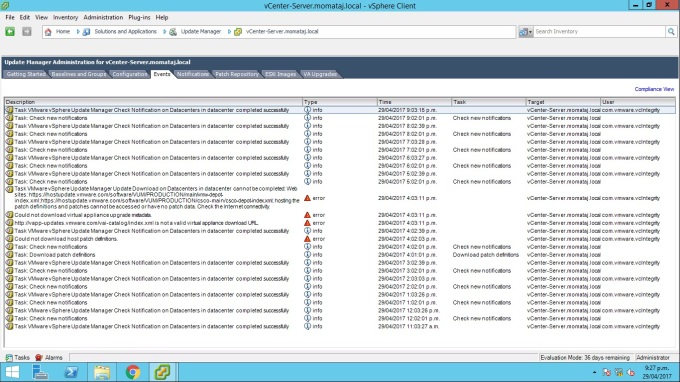
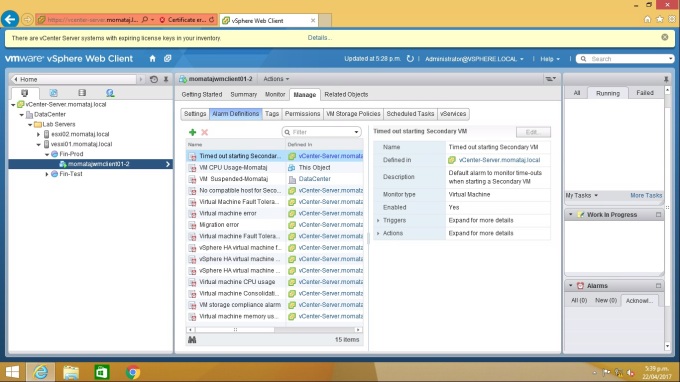
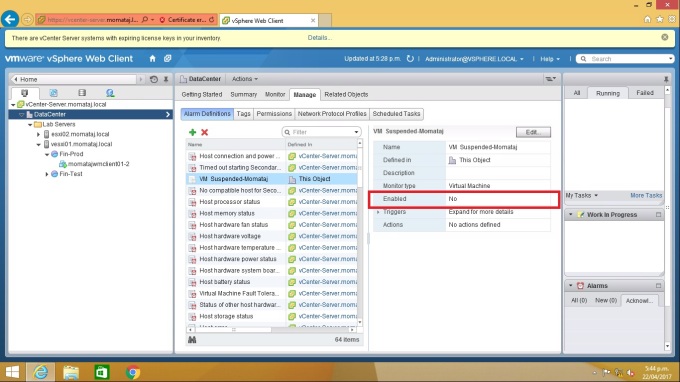
Admin view:
You can also monitor VMware vSphere Update Manager status details from “Admin view”. Note that: you must have Windows administrator credentials to install Update Manager in your infrastructure.
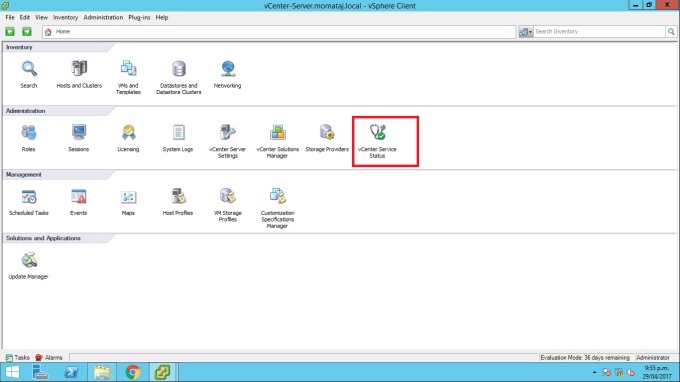
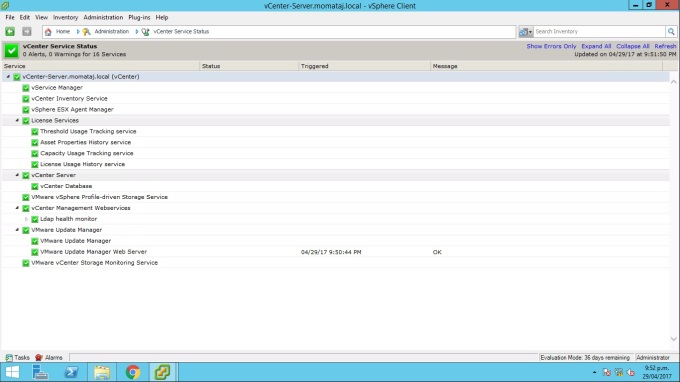
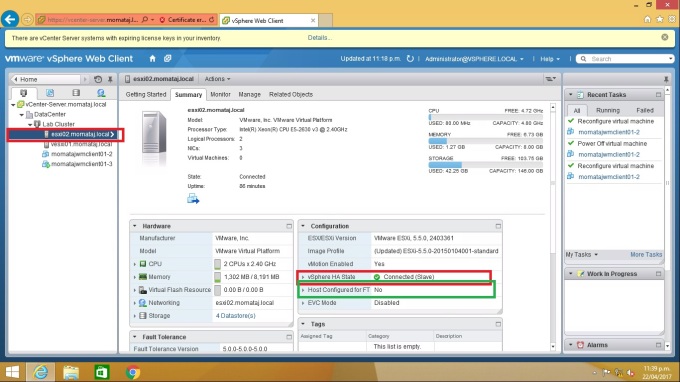
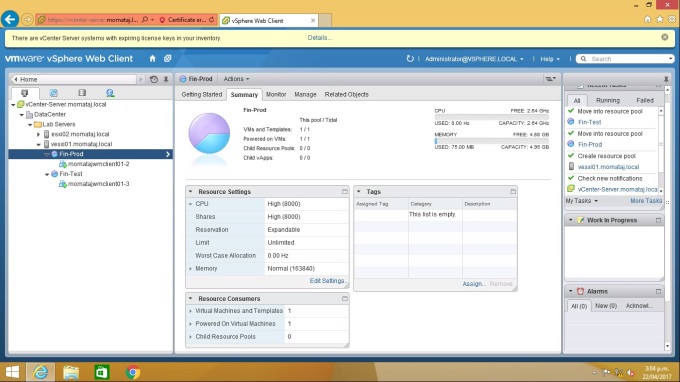
VMware vSphere vCenter Server Service Status Check:
You can also check vCenter Server service status from Home ->vCenter Service Status. It will give you an overall review of your vCenter Server Service including health report, alerts and warning report, and activated services status.
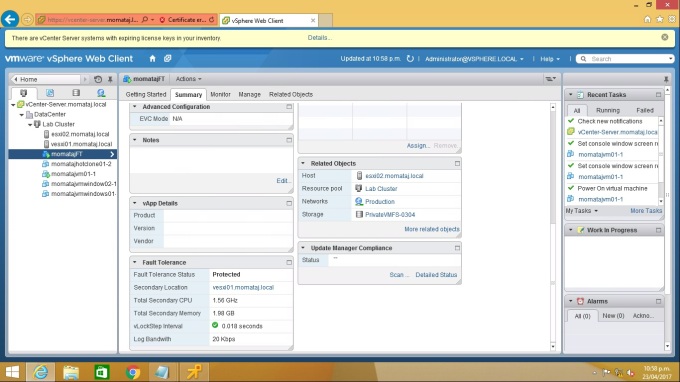
This screenshot is my vCenter Server service status. You can see I am using 16 services and no alert and warning for those services. Green colour indicated here that system health report is positive.
Thank you 🙂


You must be logged in to post a comment.